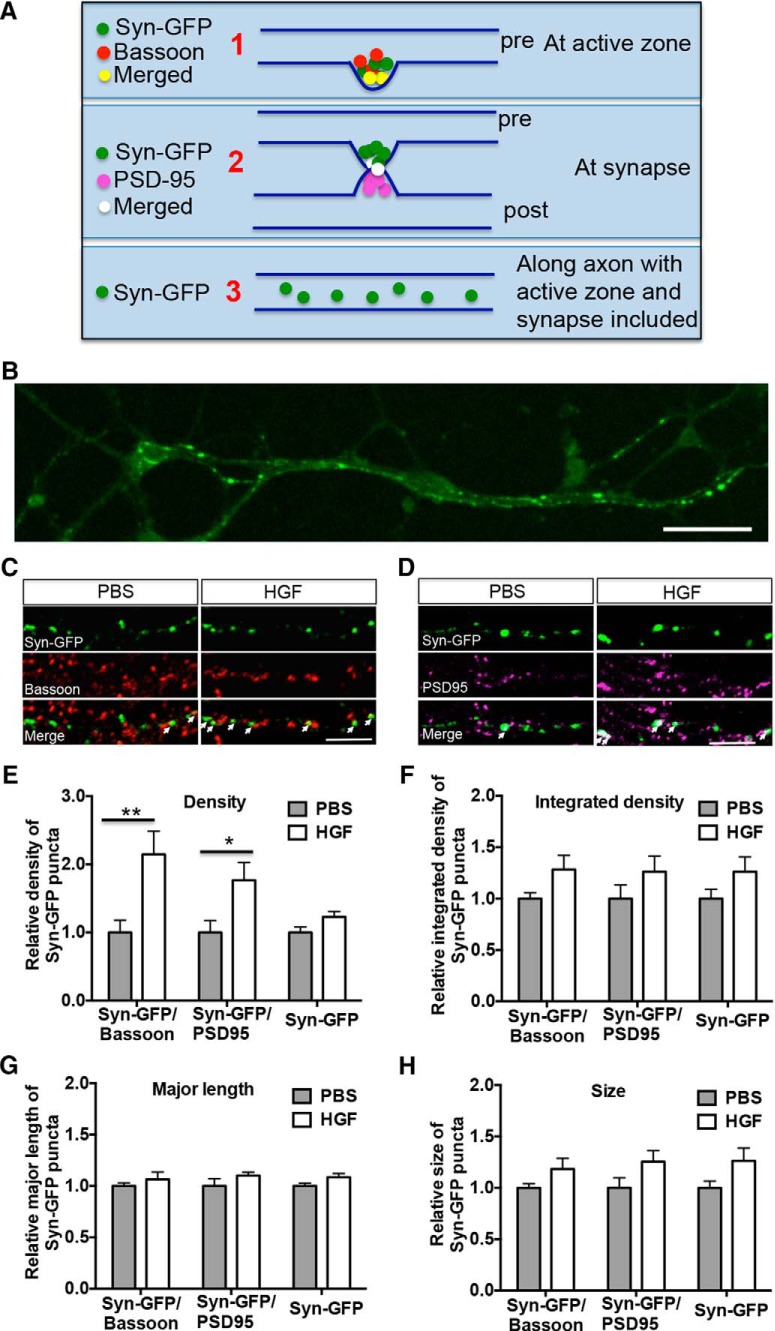
Figure 5.
MET activation increases the density of Syn-GFP/bassoon and Syn-GFP/PSD-95 clusters in neocortical neurons. A, Diagram of Syn-GFP cluster assay. Neocortical neurons were transfected with Syn-GFP at 5 DIV and treated with PBS or HGF (25 ng/ml) for 10 min at 14 DIV. Measurements were made of (1) Syn-GFP/bassoon (a marker of the active zone) colabeled clusters, (2) Syn-GFP/PSD-95 (a marker of the postsynaptic density) colabeled clusters, and (3) clusters labeled with Syn-GFP along the axon (with active zone and synapse included). B, Representative confocal microscopy image of Syn-GFP-transfected (green) neurons. Note that Syn-GFP clusters are present along axons but not dendrites. Scale bar, 50 μm. C, D, Representative confocal microscopy images of Syn-GFP (green), bassoon (red), and PSD-95 (magenta) immunoreactivity in neocortical neurons. White arrows indicate clusters colabeled with Syn-GFP/bassoon (C) or Syn-GFP/PSD-95 (D). Scale bars: C, D, 5 μm. E–H, Quantitative analysis of the density (E), integrated density (F), major length (G), and size (H) of Syn-GFP clusters. Each parameter was normalized in each culturing session to the mean value of Syn-GFP clusters in the PBS-treated group. Error bars represent the SEM; N = 18 cells from three independent cultures in each group. Increases in colabeling of presynaptic/postsynaptic markers are evident following HGF stimulation. *p < 0.05, **p < 0.01 (HGF vs PBS).

