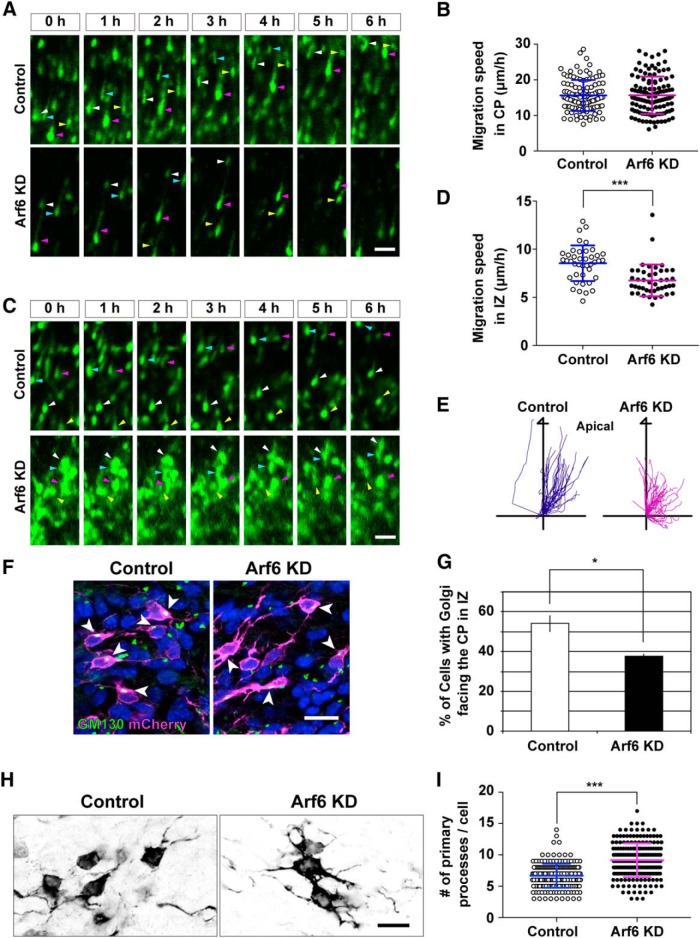
Figure 3.
Arf6 is important for neuronal migration in the IZ. A, C, Representative time-lapse images of transfected migrating neurons in the CP and IZ. Embryos were electroporated with the indicated shRNA in combination with pCAGGS-Cre recombinase and pCAGGS-Floxp carrying EGFP, EGFP-NLS, and EGFP-Fyn at E14.5, and brains were subjected to slice culture and time-lapse observations at E17.5. Arrowheads indicate transfected neurons. B, D, Quantification of the migration speed of transfected neurons in the CP (B, n = 115 cells from 3 embryos) and IZ [D, Control, n = 41 cells from 3 embryos; Arf6 knockdown (Arf6 KD), n = 43 cells from 3 embryos]. E, Tracking analysis of migration of transfected neurons in the IZ. The graphs show the trajectory of individual migrating neurons (Control, 41 cells; Arf6 KD, 43 cells from 3 embryos) for 10–13 h. F, The orientation of the Golgi apparatus in migrating neurons in the IZ. Arrowheads indicate the Golgi apparatus labeled by GM130 in transfected neurons in the IZ. G, Quantification of the proportion of cells in the IZ with the Golgi apparatus facing the CP. Note the disorientation of Golgi apparatus in Arf6-KD neurons (n = 3 embryos). H, Representative micrographs showing the morphology of transfected neurons in the IZ at E16.5. Brains were electroporated with the indicated shRNA plasmids in combination with pCAGGS-EGFP at E14.5 and immunostained with an anti-EGFP antibody. I, Quantification of the number of primary processes. Note the increase in primary processes in migrating neurons transfected with Arf6-KD plasmid (Control, n = 195 cells from 3 embryos; Arf6 KD, n = 208 cells from 3 embryos). Data were presented as mean ± SD, and statistically analyzed by unpaired t test (*P < 0.05, ***P < 0.0005). Scale bars: A, C, 50 μm; F, H, 20 μm.

