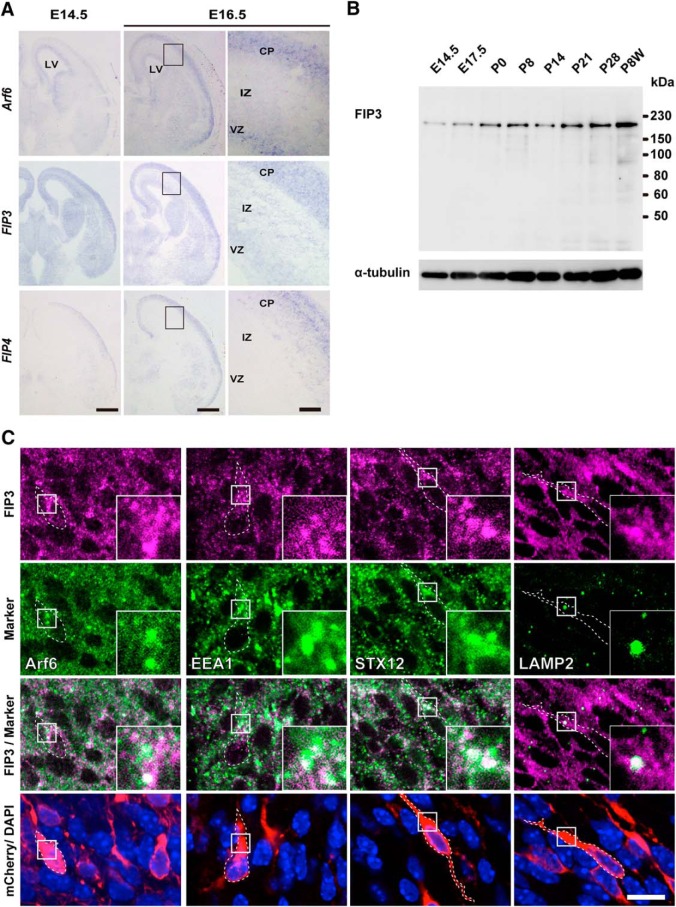
Figure 7.
Expression of FIP3 in the developing cerebral cortex. A, Representative micrographs showing the gene expression of Arf6, FIP3, and FIP4 in the developing cerebral cortex. Coronal sections of mouse cerebral cortices at E14.5 and E16.5 were subjected to nonradioactive in situ hybridization analysis for Arf6, FIP3, and FIP4. Right, Magnified views of the boxed region in the middle panel. Note the widespread gene expression of FIP3 and Arf6 in the VZ, IZ, and CP in contrast to the preferential gene expression of FIP4 in the CP. B, Immunoblot analysis of developing cerebral cortices with anti-FIP3 and anti-α-tubulin antibodies. Note the gradual increase in FIP3 during cortical development. The positions and sizes of the molecular weight markers are indicated on the right. C, Representative micrographs showing the subcellular localization of FIP3 in migrating neurons in the IZ at E17.5. Coronal sections of the cerebral cortex, which had been electroporated with pCAGGS-mCherry at E14.5, were subjected to immunofluorescent staining with antibodies against FIP3 (magenta), the indicated markers (green), and mCherry (red). Nuclei were counterstained with DAPI (blue). Insets show the high-magnification views of boxed areas. Scale bars: A, left, middle, 500 μm; A, right, 10 μm; C, 20 μm.

