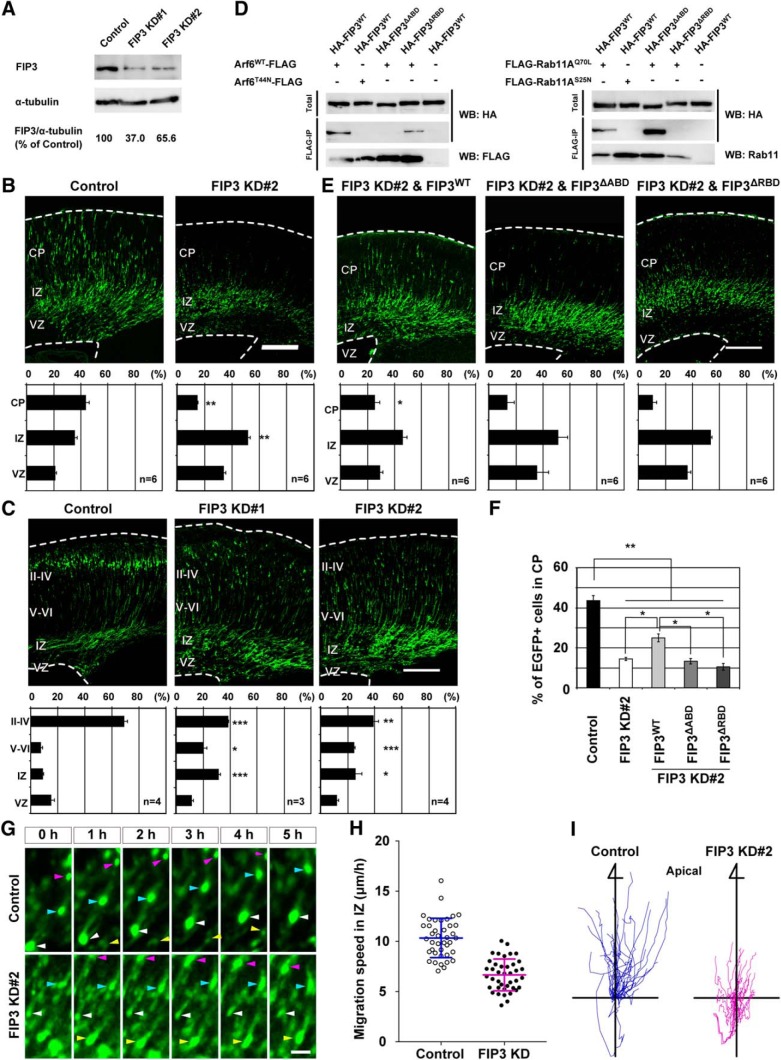
Figure 8.
FIP3 regulates neuronal migration in the IZ through the interaction with Arf6 and Rab11. A, Immunoblot analysis showing the efficiency of FIP3 shRNAs (FIP3 KD#1 and #2) in primary cortical neurons. The numbers indicate the percentage of endogenous FIP3 expression level relative to α-tubulin. Note that the expression of FIP3 KD#1 and #2 decreased endogenous FIP3 by 37.0 and 65.6%, respectively. B, C, E, Representative images of coronal sections of E17.5 (Band E) and P0 (C) cerebral cortices electroporated with Control, FIP3 knockdown (B and C), or FIP3 KD#2 and FIP3WT, FIP3ΔABD, or FIP3ΔRBD (E) in combination with pCAGGS-EGFP at E14.5. The bottom graphs show the quantification of the distribution of EGFP-positive neurons in each layer. n in the graph indicates the number of embryos examined. D, Immunoprecipitation. HeLa cells were transfected with the indicated combinations of plasmids and subjected to immunoprecipitation with anti-FLAG affinity gel. Immunoprecipitates and total lysates were subjected to an immunoblot analysis with anti-HA or anti-FLAG antibodies. Note the lack of the ability of FIP3ΔABD and FIP3ΔRBD to interact with Arf6 and Rab11, respectively. WB, Western blot. F, Comparison of the percentage of EGFP-positive cells transfected with the indicated plasmids in the CP at E17.5. Note the ability of FIP3WT but not FIP3ΔABD or FIP3ΔRBD to partially rescue the disturbed cortical layer formation caused by the knockdown of FIP3. G, Representative time-lapse images of transfected neurons in the IZ. Embryos were electroporated with the indicated shRNAs, pCAGGS-Cre recombinase, and pCAGGS-Floxp carrying EGFP, EGFP-NLS, and EGFP-Fyn at E14.5, and subjected to time-lapse observations at E17.5. Arrowheads indicate transfected neurons. H, Quantification of the migration speed of transfected neurons in the IZ (n = 40 cells from 3 embryos). Note the decrease in the migration speed of FIP3 KD#2-transfected neurons compared with that of control neurons. I, Tracking analysis of migration of transfected neurons in the IZ. The graphs show the trajectory of migrating neurons for 10–13 h (n = 40 cells from 3 embryos). Data were presented as mean ± SEM (B, C, E, F) and mean ± SD (H), and statistically analyzed using one-way ANOVA followed by post hoc Tukey-Kramer’s test in B (vs control) and E (vs FIP3 KD#2 in B; *P < 0.05, ** P < 0.01), and unpaired t test in C and H(vs control; *P < 0.05, ** P < 0.005, ***P < 0.0005). The total numbers of examined animals were indicated in the graphs in B, C,and E. Scale bars: B, C, E, 200 μm; F, 50 μm.

