
FIGURE 3.
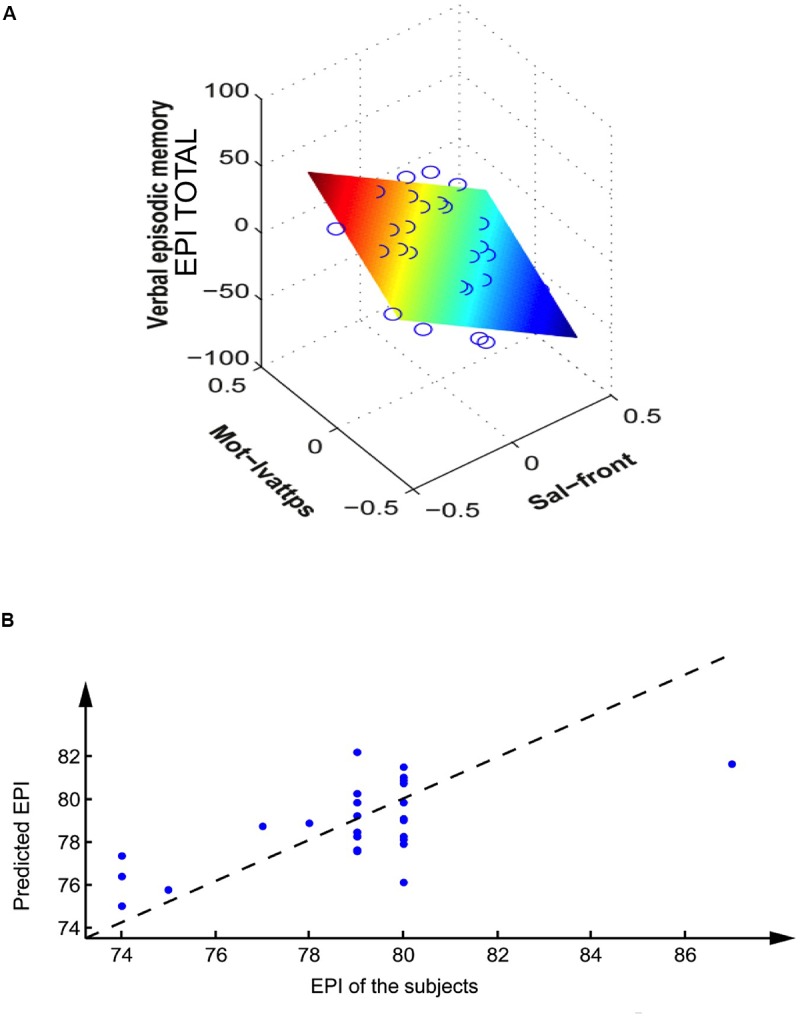
Prediction of EPI total (verbal episodic memory) of the subjects from their rs-fMRI inter network activity. (A) Linear regression on the corrected variables (correction by volume and age). Each circle represents a subject, the colored plane represents the linear regression. (B) Non-linear regression based on the multilayer perceptron, on the variables after volume and age correction, on the leave-one-out validation set. Each dot represents a subject; the dashed line represents the optimum (obtained with a linear perceptron without hidden units).