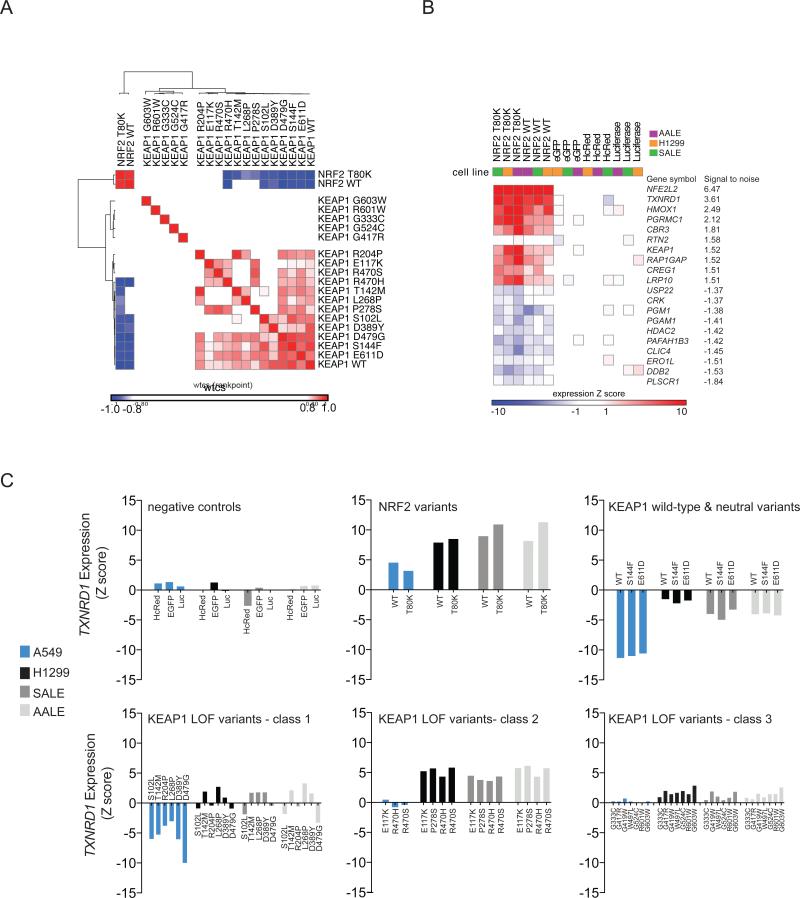
Figure 3. Hypomorphic and Dominant-negative KEAP1 Variants Identified by Gene Expression Profiling.
(A) Hierarchical clustering of KEAP1 expression signatures in A549 cells. The similarity matrix was computed using the weighted connectivity score (wtcs) as the similarity metric.
(B) Two-class comparison of NRF2 ORF signatures versus control (EGFP, HcRed, Luciferase) signatures across three KEAP1 wild-type cell lines (AALE, SALE, H1299). The top transcripts up- or down-regulated by NFE2L2 expression were determined by a signal-to-noise statistic.
(C) Expression of the direct NRF2 transcriptional target TXNRD1 is shown as a biosensor of NRF2 and KEAP1 activity. Upper panels show NRF2 variants and KEAP1 wild-type and neutral variants. The lower panels show three classes of loss-of-function KEAP1 variants identified by hierarchical clustering of expression profiles generated in four cellular contexts: A549 (KEAP1 mutant) and three KEAP1 wild-type cell lines, H1299, SALE, and AALE.

