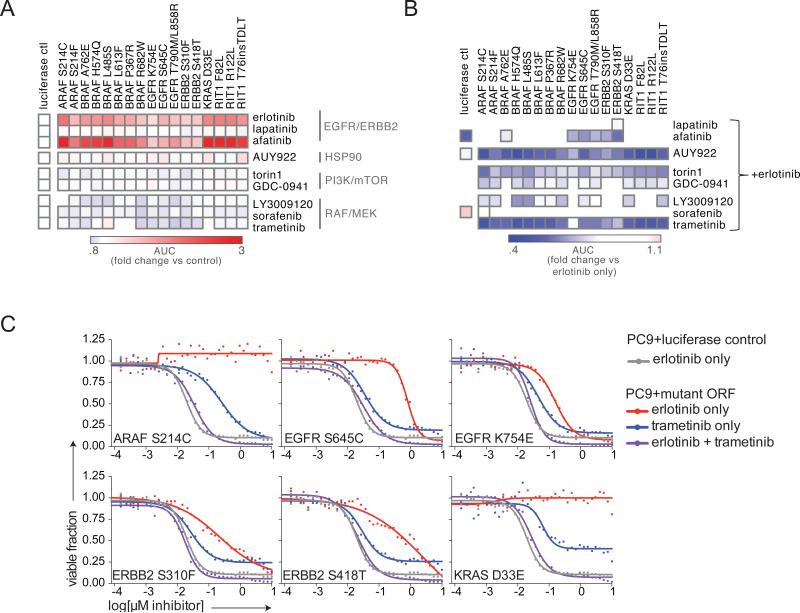
Figure 7. Sensitivity of Rare Oncogenic Mutations to MEK Inhibition.
(A) Viability of PC9 stable isogenic cell lines after treatment with the small molecules shown for 96 hours. 36-point dose response curves were performed and curves plotted in GraphPad Prism. Data shown are the ratio of the area-under-the-curve (AUC) of the mutant PC9 line vs. the PC9-luciferase negative control.
(B) Viability of PC9 stable isogenic cell lines after treatment with the small molecules shown in combination with erlotinib. Inhibitors were delivered in a 1:1 molar ratio across a 36-point dose-response curve. Data shown are the ratio of the AUC of the mutant PC9 line in the combination treatment vs. the AUC of the mutant PC9 in erlotinib only. Note that EGFR K754E appears to be the least sensitive to trametinib inhibition but this is actually due to EGFR K754E conferring the least resistance to trametinib, as shown in panel (C).
(C) Dose-response curves of PC9 stable isogenic cell lines expressing EGFR, ERBB2, or KRAS variants. Data shown are the same curves used to generate the heat maps in panel (B).
See also Figure S5.

