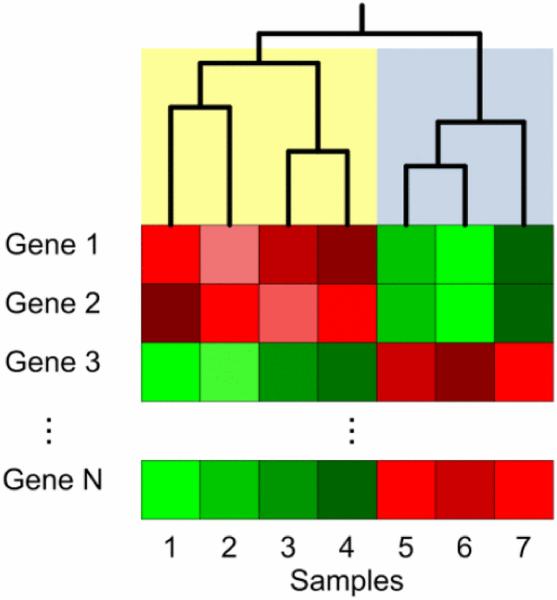
Fig. 2.
Illustration of hierarchical clustering of seven samples, each with Formula genes. Gene expression is usually represented by a heatmap. Two large clusters emerge in this example. One cluster, shaded in yellow, contains samples 1, 2, 3, and 4. The second cluster, shaded in blue, contains samples 5, 6, and 7. Each cluster, in turn, contains smaller clusters of 1 or 2 samples.

