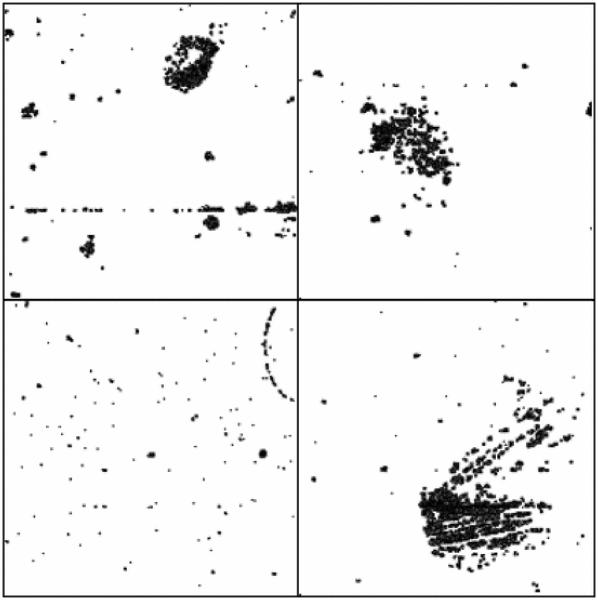
Fig. 4.
caCORRECT identifies spatial artifacts in microarrays from Dataset 1 (Blood Gene Exp. CAD). These spatial artifacts represent regions of high variance. We can qualitatively assess the integrity of each microarray by examining the coverage of the artifact masks. Spatial artifacts resembling scratches or other statistically unlikely shapes can indicate defects in the microarray or substandard experimental procedures.

