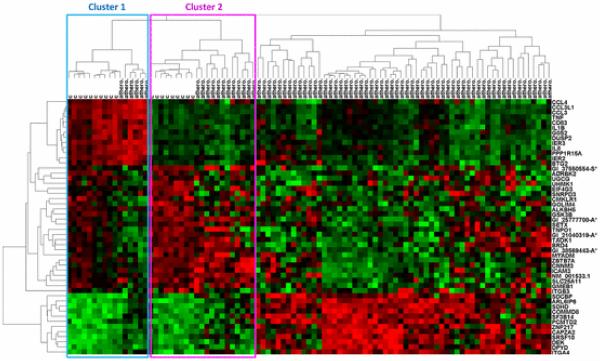
Fig. 5.
Hierarchical clustering of Dataset 4 (Monocytes Athero.), an atherosclerosis microarray dataset with 95 samples and 50 genes (filtered from 24 350 genes using SAM). Microarray samples, clustered horizontally, fall into three large clusters with varying degrees of atherosclerosis. Clusters 1 and 2 contain a mixture of control and atherosclerosis samples. The remaining samples cluster into a large group containing all atherosclerosis samples. Genes (clustered vertically) also tend to cluster into groups with similar expression. Hierarchical clustering was performed using complete linkage and Euclidean distance.

