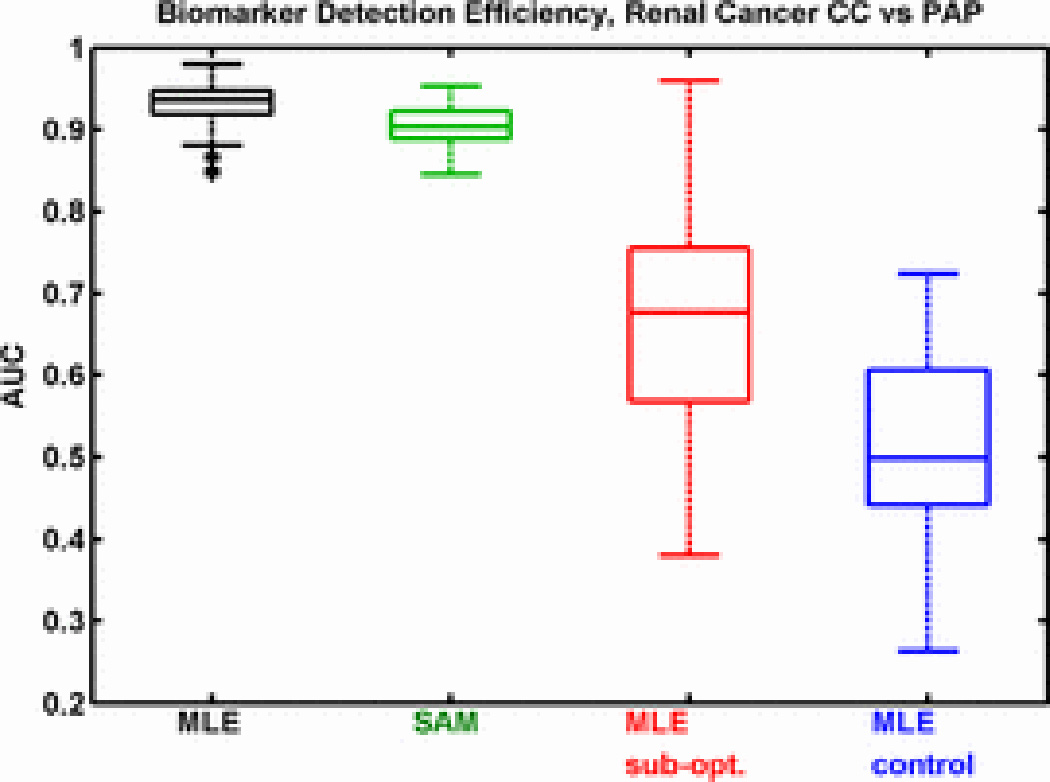
Figure 4.

Area under the curve (AUC) plots representing biomarker detection efficiency for several feature ranking metrics. A larger AUC indicates higher detection efficiency. The optimal ranking metric, selected using maximum likelihood estimation (MLE), is more efficient compared to significance analysis of microarrays (SAM), a standard ranking method. The use of sub-optimal knowledge (sub-opt) when selecting the ranking metric decreases detection efficiency. When using randomly selected genes as knowledge, detection efficiency is random (control).
