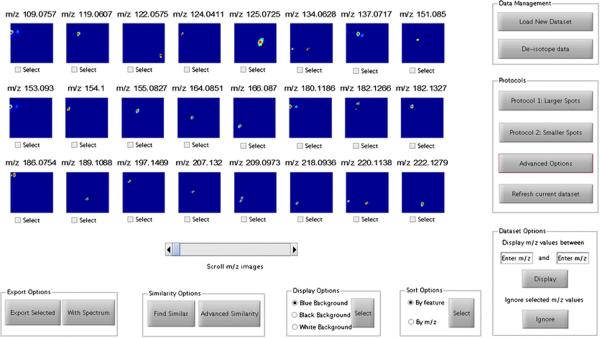
Figure 3.
The main graphical user interface with the top 24 images containing spot-like regions are displayed. Data is first uploaded and (optionally) de-isotoped, following which the users may select from Protocol 1 or Protocol 2 for feature selection, or design their own processing pipeline through the Advanced Options tab. Spots with similar spatial distributions may be identified using the Similarity Options. Selected images and/or spectra may be exported using the Export Options

