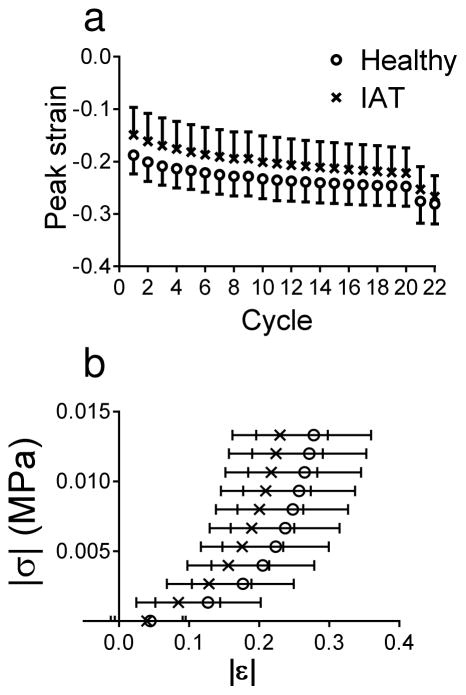
Figure 4.
(a) Peak strain for each loading cycle in healthy and IAT specimens. Due to cyclic creep, the magnitude of the peak strain appeared to grow with each progressive cycle. At cycle 20, the peak strain was approaching its equilibrium value. The strain then dropped precipitously in the slow loading cycles (cycle 21 and 22). Note that most analyses were performed for cycle 20. Data are mean ± standard deviation. (b) Stress-strain loading curve for healthy and IAT specimens. In cycle 20, the absolute value of the stress appeared to increase sharply at lower compressive strains in IAT specimens than in healthy specimen. Data are mean ± standard deviation.

