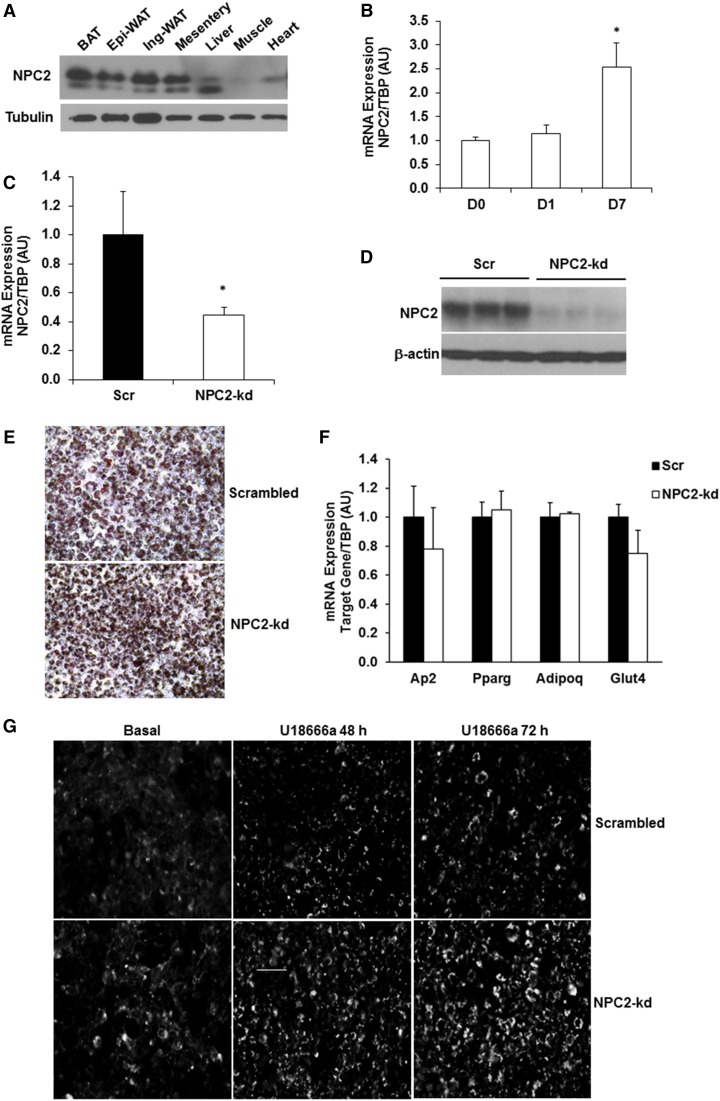
Fig. 1.
NPC2 kd in 3T3-L1 adipocytes. A: NPC2 protein expression in different tissues. B: The gene expression of Npc2 in 3T3-L1 cells during differentiation. C: Npc2 mRNA expression in 3T3-L1 adipocytes was quantified by quantitative PCR. D: Protein expression of NPC2 in 3T3-L1 adipocytes by Western blot. E: Oil Red O staining of 3T3-L1 cells on day 8 of differentiation. F: Adipogenic gene expression in 3T3-L1 adipocytes on day 8 of differentiation (n = 4 in each group). G: Filipin III fluorescence image of scrambled and NPC2-kd adipocytes treated with 10 μg/ml U18666a for 48 and 72 h, respectively. Images were acquired using the automatic fluorescence microscope at 20× magnification. Scale bar = 50 μm. Data are expressed relative to the value for scrambled (Scr) cells. The values are mean ± SEM. *P < 0.001 versus scrambled cells. Ap2, adipocyte P2; PPARg, peroxisome proliferator-activated receptor gamma; Adipoq, adiponectin; Glut4, glucose transporter type 4.

