Fig. 1.

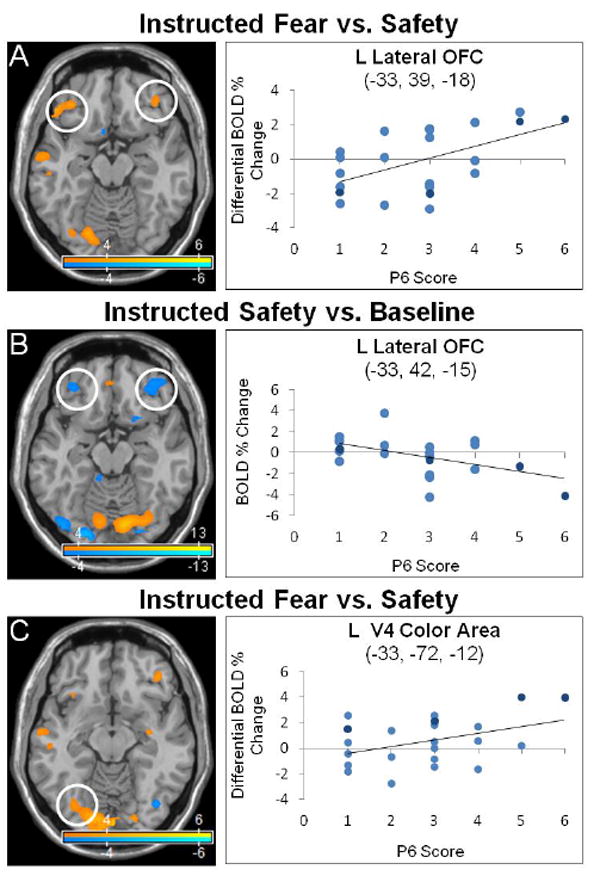
Lateral orbitofrontal cortex and V4 color area activations correlated to persecutory delusion severity in the instructed-fear/safety paradigm. Neural activations correlated with persecutory delusion severity (P6 score) were studied in patients with schizophrenia using an instructed-fear/safety paradigm. Fear and safety cues were distinguished by delivery of different colored squares. Statistical parametric maps show blood-oxygen-level-dependent (BOLD) neural activation changes thresholded at a voxelwise p-value of 0.001 for visualization purposes. (A) A positive correlation was observed between P6 scores and left (-33, 39, -18: peak z-score = 4.545, corrected p-value = 0.002) and right (42, 39, -12: peak z-score = 3.836, corrected p-value = 0.029) lateral orbitofrontal cortex (OFC) in the instructed-fear vs. safety contrast. (B) A negative correlation was observed between P6 scores and left (-33, 42, -15: peak z-score = 4.035, corrected p-value = 0.015) and right (39, 45, -12: peak z-score = 4.587, corrected p-value = 0.002) lateral OFC activations in the instructed-safety vs. baseline contrast. (C) Left V4 color area activation correlated with P6 scores in the instructed-fear vs. safety contrast (-33, -72, -12; peak z-score = 3.719, corrected p-value = 0.043), while reduced V4 color area activation correlated with P6 scores in the instructed-safety vs. baseline contrast (-24, -84, -9; peak z-score = > 8, corrected p-value < 0.001; not shown). In the scatter plots, light blue indicates schizophrenia subjects, dark blue schizoaffective subjects.
