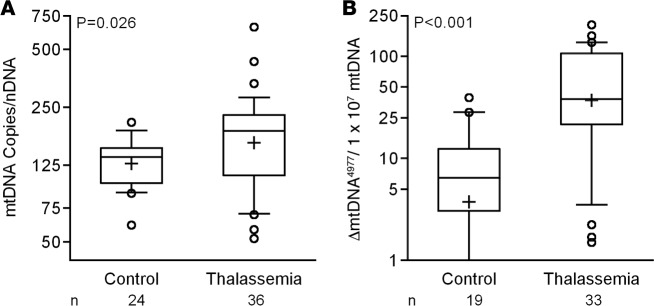
Figure 1. Mitochondrial DNA (mtDNA) in leukocytes from subjects with thalassemia shows specific alterations.
(A) Increase in mtDNA copy number (P = 0.026) and (B) the frequency of 4977-bp mitochondrial DNA deletion (ΔmtDNA4977) (P < 0.001) in thalassemia compared with controls. The plots show median, with box extending from the 25th to 75th percentile and the whiskers extending from 10th to 90th percentile values, while mean values are shown as “+” and outliers as open circles. Unpaired 2-tailed Student’s t test on log-transformed data was used for statistical analysis comparing group means. The analysis included 24 control and 36 thalassemia subjects in the analysis of mtDNA copy number (A), along with 19 control and 33 thalassemia subjects in the analysis of frequency of ΔmtDNA4977 (B).

