Figure 4.
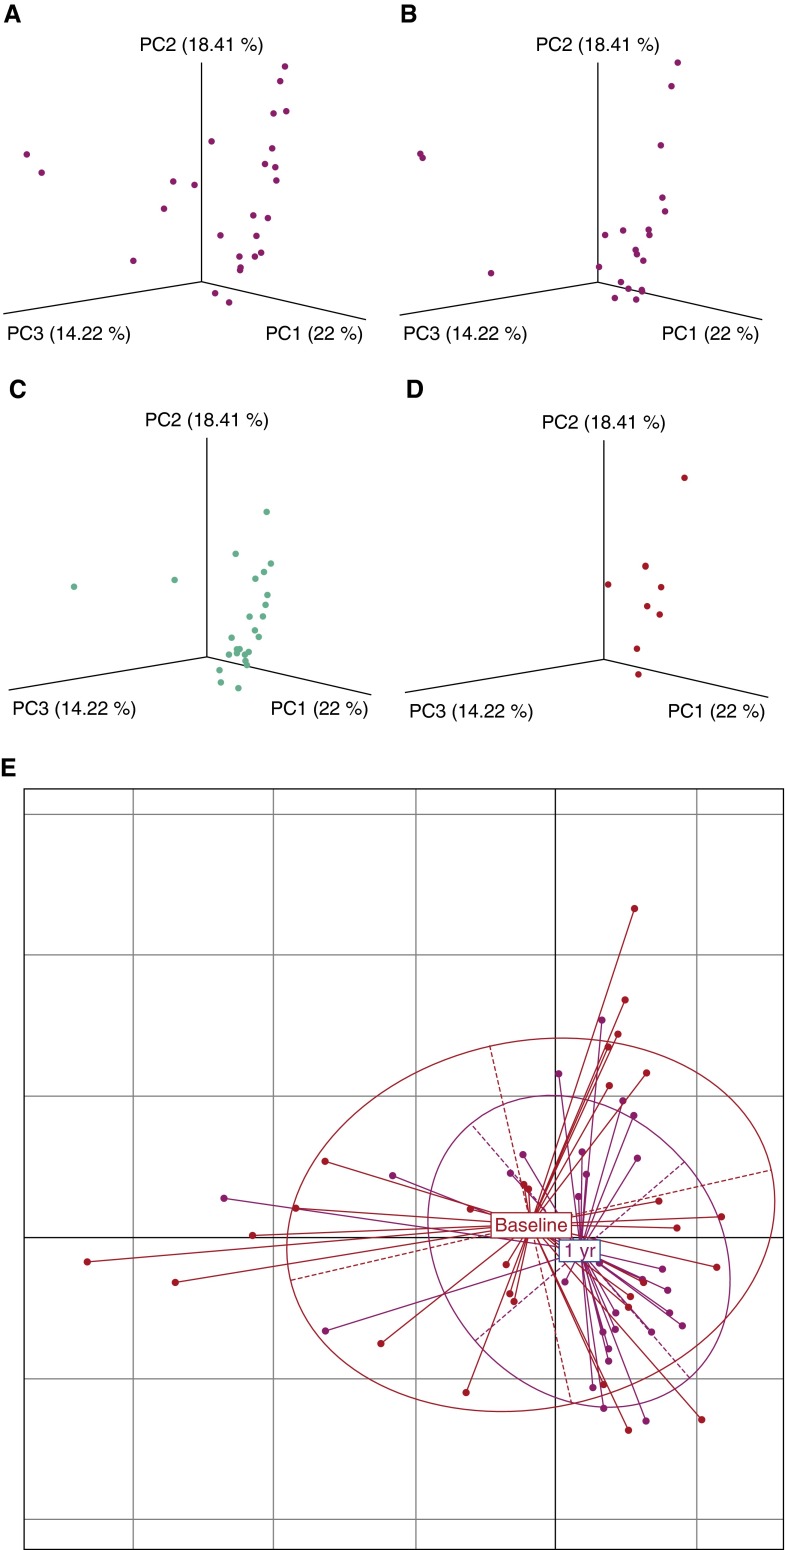
(A–D) UniFrac principal coordinates analysis of bronchoalveolar lavage samples from subjects infected with HIV before treatment and at 4 weeks, 1 year, and 3 years after therapy. With time on therapy, the subjects infected with HIV demonstrate more clustering, indicating a decrease in beta diversity within the population. (E) Principal coordinates analysis scatter plot of baseline and 1 year after treatment groups using weighted UniFrac distances. Multivariate homogeneity of group dispersions analysis showed dispersion of the population infected with HIV after 1 year of therapy was significantly less than in the untreated population (P = 0.005). PC = principal coordinate.

