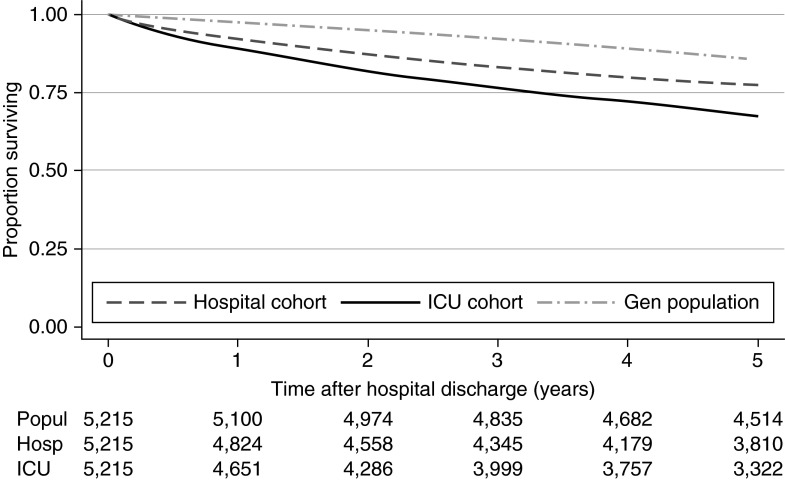
Figure 1.
Kaplan-Meier plot of 5-year survival after hospital discharge for the intensive care unit (ICU) survivor cohort, hospital cohort, and general population of Scotland. General population mortality rates were derived using age–sex indirect standardization. Gen = general; Popul = general population at risk of event; Hosp = hospital control cohort at risk of event; ICU = ICU cohort at risk of event.

