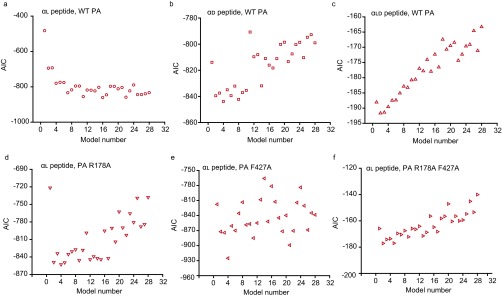
Fig. S5.
Best-fit chemical kinetic schemes for translocation. To evaluate the quality of the fits to the closed-state CDFs (Fig. 3B) using the various translocation kinetic models (Fig. S4), the AIC was plotted for each model for the (A) αl, (B) αd, and (C) αld peptides in WT PA and (D) PA R178A, (E) PA F427A, and (F) PA R178A F427A with the αl peptide. AIC (y axis) is plotted against the x axis, which is numbered according to the schemes listed in Fig. S4. AIC is calculated by AIC = n log(RSS/n) + 2(k + 1), where RSS is residual sum of squares, n is number of data points, and k is number of parameters in each tested chemical kinetic model.

