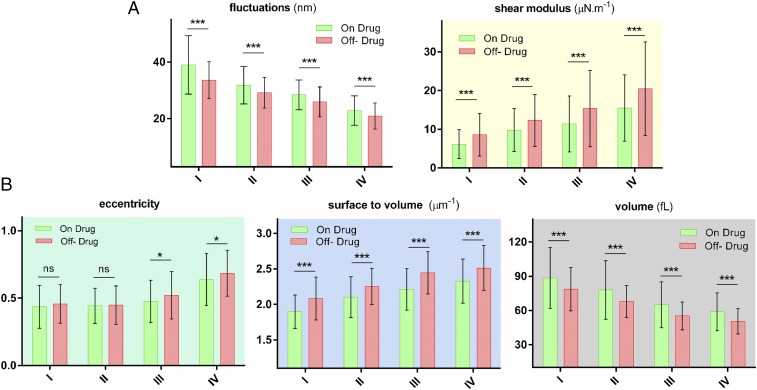
Fig. 4.
Biophysical properties of individual RBCs for “on” and “off” HU drug patients. (A) Biomechanical properties as a function of four different cell densities. (B) Morphological parameters as a function of cell density. The number of measurements per patient for each density categories varies between 20 and 25 incidents. The exact numbers for each measurement are as follows: Non = 126, 136, 136, and 128, and Noff = 172, 187, 164, and 165, for density I, II, III, and IV, respectively. The height of bar graph in each case represents the mean value, whereas the vertical error bars represent ±SD. Standard two-tailed t tests were used to determine the significance of the difference between two groups of data, where *P < 0.05, ***P < 0.001, and “ns” indicates P > 0.05.

