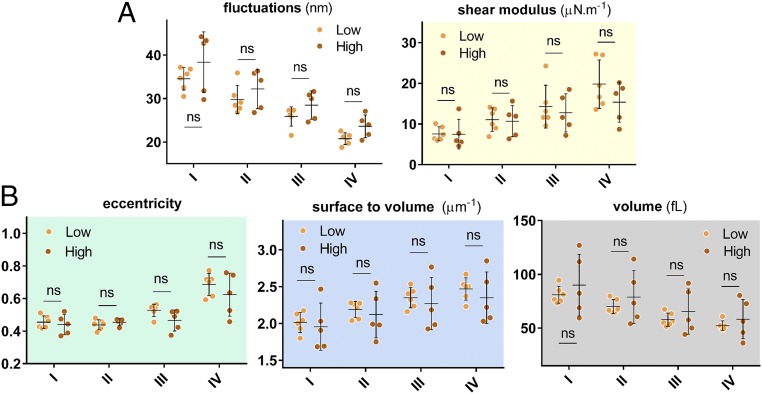
Fig. 6.
Biophysical properties of RBCs of SCD patients grouped based on HbF percentage. “Low” and “High” in these figures represent HbF values relative to the median for all patients, which is 8.5%. (A) Biomechanical properties as a function of the cell density and HbF level. (B) Morphological parameters as a function of the cell density and HbF level. Dots represent mean values for individual patients. There is no statistically significant difference between patients with low and high clinically measured HbF levels. Standard two-tailed t tests were used to determine the significance of the difference between two groups of data, where “ns” indicates P > 0.05.

