Fig. 3.
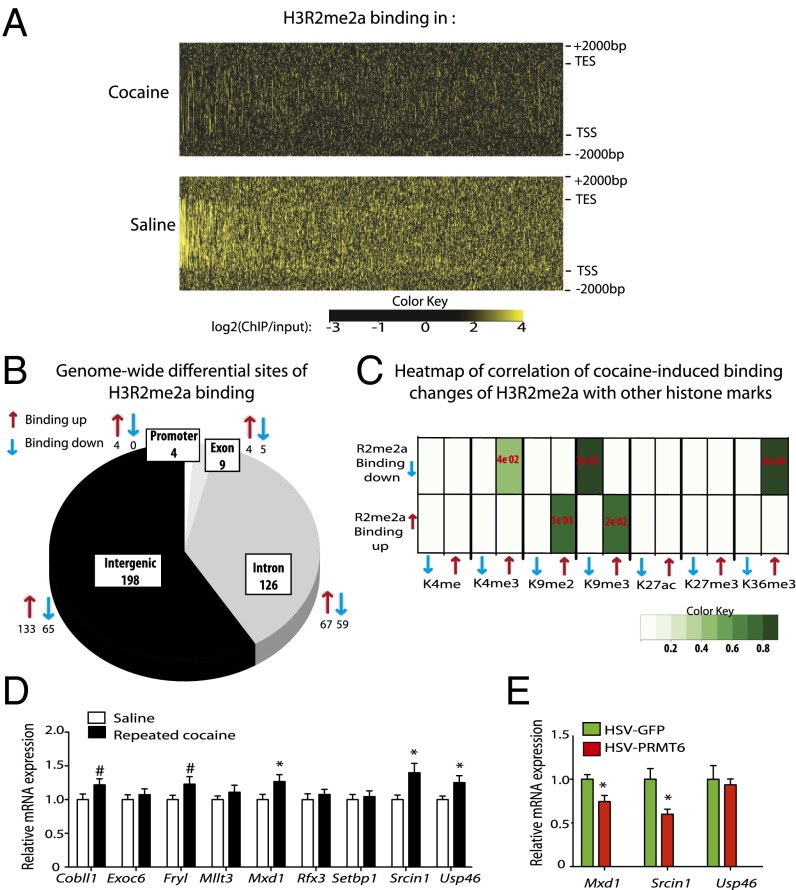
H3R2me2a is regulated genome-wide in the NAc after repeated cocaine. (A) Averaged genome-wide heatmap profile of three independent biological replicates of H3R2me2a binding under saline (Lower) and cocaine (Upper) conditions. Each line of the x-axis represents a single gene, arranged in order of decreasing H3R2me2a-binding enrichment in saline conditions. The y-axis represents the genomic region from 5′ to 3′ with 2,000 bp upstream of TSSs and downstream of transcription end sites (TESs). (B) Pie chart showing ChIP-seq genome-wide distribution patterns of significant differential H3R2me2a-binding sites in the NAc between saline and cocaine conditions. Arrows represent sites showing a significant cocaine-induced increase (red) or decrease (blue) in H3R2me2a binding. Cocaine induced 337 differential H3R2me2a-binding sites, among which 129 were decreased and 208 were increased with cocaine. (C) Heatmap of correlation between cocaine-induced H3R2me2a differential binding sites (diffReps) and seven other chromatin modification differential binding sites (H3K4me1, H3K4me3, H3K9me2, H3K9me3, H3K27ac, H3K27me3, and H3K36me3). Binding up/down (red/blue arrow) indicates differential binding sites increased/ decreased after cocaine. The shade of green indicates the odds ratio (i.e., observation/expectation) of enrichments. The P values of enrichments were determined using Fisher’s exact test and are labeled in red. (D) NAc mRNA levels of nine genes characterized by a cocaine-induced decrease in H3R2me2a binding and an increase in H3K4me3 binding. NAc mRNA levels are compared with those of saline-treated animals for Cobll1 [t(27) = 1.759, P = 0.0433], Fryl [t(27) = 1.784, P = 0.0662], Mxd1 [t(27) = 2.108, P = 0.022], Srcin1 [t(27) = 2.535, P = 0.008], and Usp46 [t(27) = 2.151, P = 0.02]. n = 14–15. (E) Repression of gene expression in the NAc with local PRMT6 overexpression achieved with intra-NAc infusion of HSV-PRMT6 vs. HSV-GFP controls. Mxd1, t(6) = 2.108, P = 0.0126; Srcin1, t(8) = 2.921, P = 0.0096 compared with respective HSV-GFP. n = 4–5. Data are presented as mean ± SEM. #P < 0.1, *P < 0.05, **P < 0.01.

