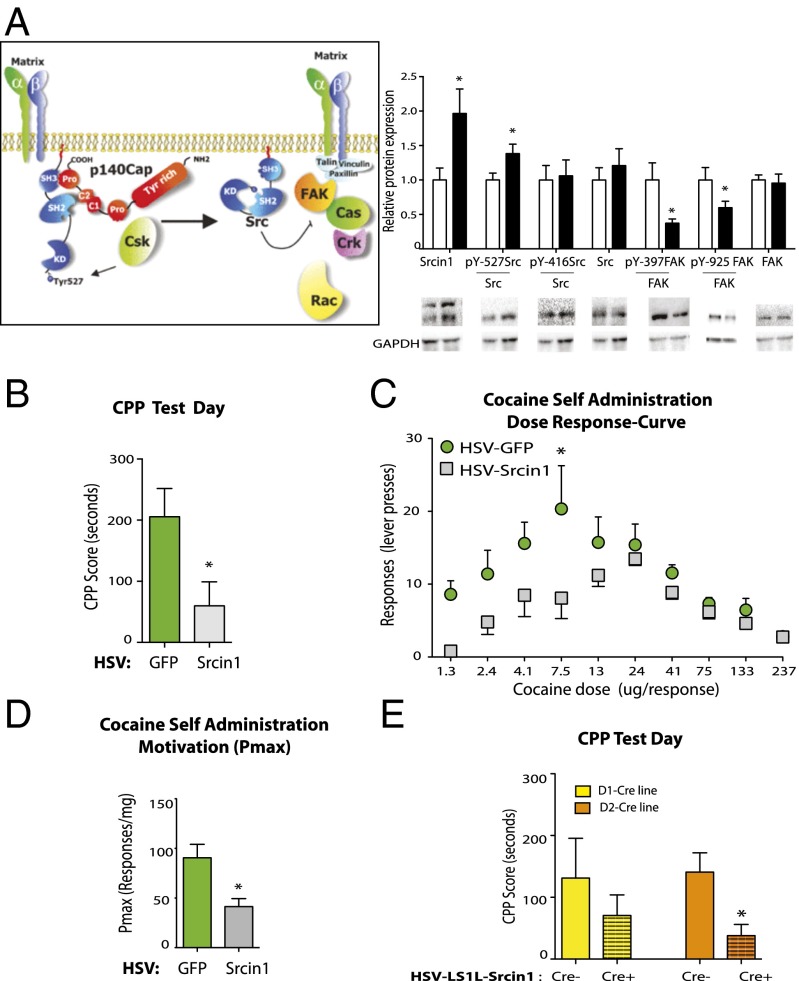
Fig. 4.
Srcin1 induction in the NAc opposes cocaine-induced behaviors. (A, Left) p140Cas-associated protein, p140Cap (also known as Srcin1) intracellular signaling cascade (40). (A, Right) NAc protein levels of Srcin1 [t(41) = 2.32, P = 0.013], the inactive (phosphorylated at tyrosine Y residue 527) form of Src (pY527Src) [t(35) = 2.14, P = 0.02], the active (phosphorylated at tyrosine Y residue 416) form of Src (pY416Src), total Src, the phosphorylated at tyrosine 397 focal adhesion kinase (pY397FAK) [t(37) = 2.18, P = 0.02], the Src-dependent phosphorylated at tyrosine 925 FAK (pY925FAK) [t(44) = 2.03, P = 0.02], and total FAK. n = 16–24. (B) Srcin1 overexpression in the NAc decreased the time spent in the cocaine-paired CPP chamber [t(18) = 2.40; P = 0.03]. n = 9–13. (C and D) Overexpression of Srcin1 in the NAc decreases the reinforcing efficacy to self-administer cocaine in rats. Rats were injected intra-NAc with HSV-GFP or HSV-Srcin1 and tested 2 d later for 3 consecutive days. n = 5–6. (C) The threshold procedure paradigm was used to generate dose–response curves for cocaine and determine cocaine reinforcing efficacy. Dose–response curves occurred within a single session, and data were averaged from three sessions and presented as lever press responses vs. dose. Two-way ANOVA; virus effect: F(1, 80) = 19.74, P < 0.0001; dose effect: F(9, 80) = 6.71, P < 0.0001; interaction effect: F(9, 80) = 1.35, P = 0.22; dose GFP vs. Srcin1: t(8) = 3.75, P < 0.01. (D) Overexpression of Srcin1 in the NAc of rats decreases the motivation to self-administer cocaine. Pmax (price at which maximal responding occurs): t(8) = 3.31, *P < 0.05. (E) Cell type-specific Srcin1 overexpression in D2-MSNs in the NAc decreased the time spent in the cocaine-paired CPP chamber. Shown is cocaine CPP in D1-Cre+ and D2-Cre+ mice and their respective WT littermate controls (D1-Cre− and D2-Cre−), all of which were injected intra-NAc with HSV-LS1L-Srcin1. D1-Cre+ vs. D1-Cre−: t(9) = 0.88, P = 0.43; n = 5–6. D2-Cre+ vs. D2-Cre−: t(20) = 2.38, P = 0.04; n = 9–13. Data are presented as mean ± SEM. *P < 0.05.

