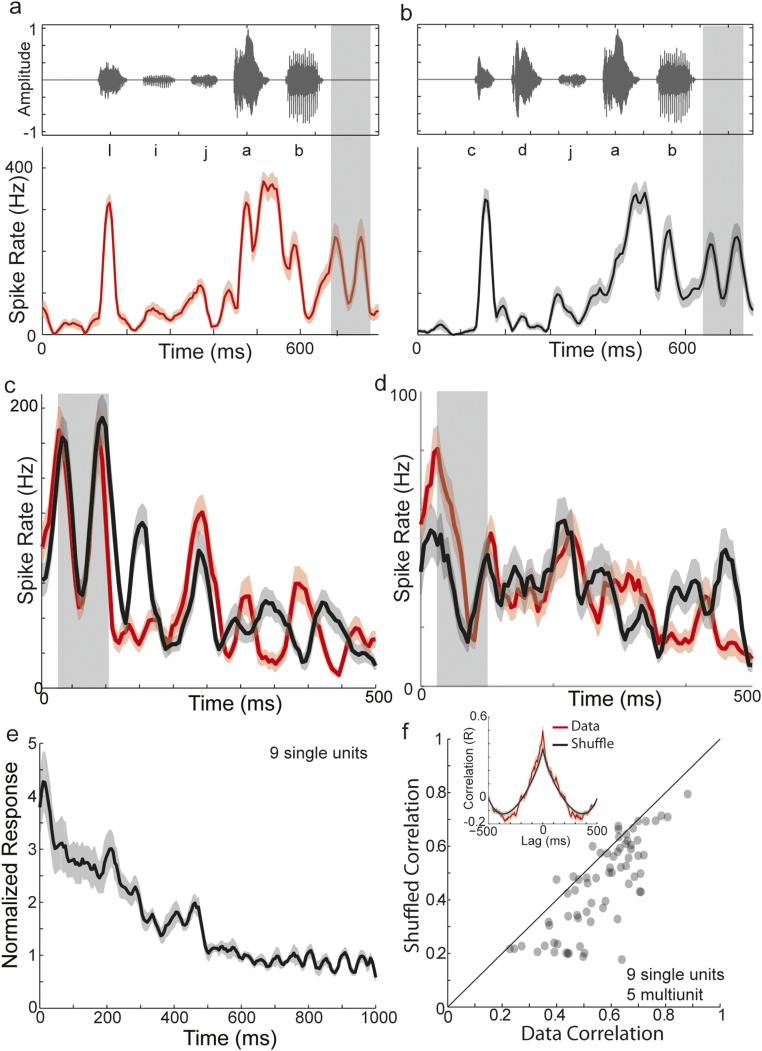
Fig. S1.
Dynamics of poststimulus activity at single units induced by short sequences of syllables. To further characterize the dynamics of poststimulus activity, we played back naturally produced sequences of syllables (four to five syllables) that ended in the same syllable. A and B show an example of two such auditory sequences (amplitude waveforms, Top) and the evoked auditory response recorded from a single unit in HVC (mean ± SE; n = 60 trials). Following the offset of the stimulus, a biphasic modulation of poststimulus activity is observed at approximately the time of the expected upcoming syllable (gray box). The poststimulus activity for these two sequences are overlaid in C, whereas D overlays single-unit poststimulus activity from a different bird in responses to an analogous stimulus pair. Qualitatively, poststimulus activity evoked by individual sequences could exhibit large fluctuations on the timescales of 50–100 ms, as evidenced by the values of the means (dark colors) relative to the SEs (lighter colors). More importantly, the poststimulus activity evoked by different sequences could also exhibit temporal fluctuations that appeared similar, especially within the first 100–250 ms. In agreement with the results for BOS, we observed that single-unit poststimulus neural activity evoked by short sequences decayed roughly exponentially back to baseline (E; n = 9 single-unit sites in three birds). To measure the consistency of the poststimulus activity dynamics evoked by different sequences at the same site, we performed a cross-covariance analysis. At each site (nine single units and five multiunits in three birds), we measured the correlation coefficient between the poststimulus activity evoked by two sequences at different lags relative to one another. The red curve of the Inset of F shows the average correlation coefficients at different lags across all pairwise comparisons of sequences across all sites (mean ± SE; n = 69 pairwise comparisons). To gauge the significance of these correlations, we randomly shuffled (100 times) the short-term structure (“signal”) while retaining the long-term structure (“carrier”) of poststimulus activity for each sequence, and performed the same cross-covariance analysis (black curve; mean ± SE; n = 69). Specifically, we calculated the best-fitting exponential (carrier) to the mean (average across trials at a site) poststimulus activity for each sequence and determined the residuals (signal). We then randomly permuted the indices (timing) of the residuals for both sequences, added these randomized “signals” to the best-fit exponentials, and then calculated the cross-covariance. Both curves in F exhibit a prominent positive peak at zero lag with symmetric negative lobes, reflecting the exponential decaying carrier. However, the peak values at zero lag were greater for the data relative to the shuffled control. Therefore, we measured the correlation coefficient around zero lag (±10 ms) for all pairwise comparisons for both real poststimulus activity as well as shuffle controls (average of values across different permutations for a pair) (F). The vast majority of points lie below the diagonal (dashed gray line), indicating the real correlations were greater than the shuffled correlations (real median = 0.59; shuffled median = 0.45; P < 10−10, Wilcoxon signed-rank test; n = 69). Together, these results indicate that the dynamics of poststimulus activity are consistently timed across playback of different sequences ending in the same last syllable, and that these features are present at single-unit sites.

