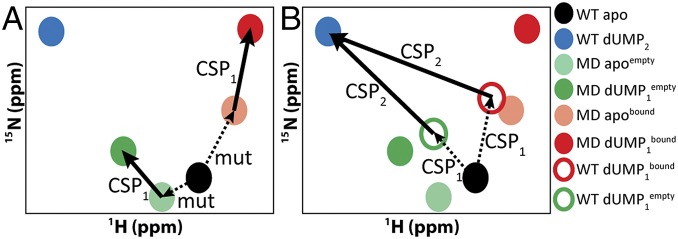
Fig. 3.
Vector correction to determine WT dUMP1 peak positions. The two schematic diagrams show how CSPs were calculated for each dUMP binding event (SI Materials and Methods). (A) The CSPs for binding the first dUMP, CSP1, were calculated directly from the apo and dUMP1 peak positions of the two mixed labeled dimer (MD) samples (thick arrows). Dashed arrows show the CSP due to the mutation (mut). (B) CSPs for binding the second dUMP, CSP2, were calculated as the vectors connecting the WT dUMP2 peak (in blue) and the dUMP1 peaks for WT (empty red and green circles), which were reconstructed by applying the CSP1 vectors to the apo WT peak (dashed arrows).

