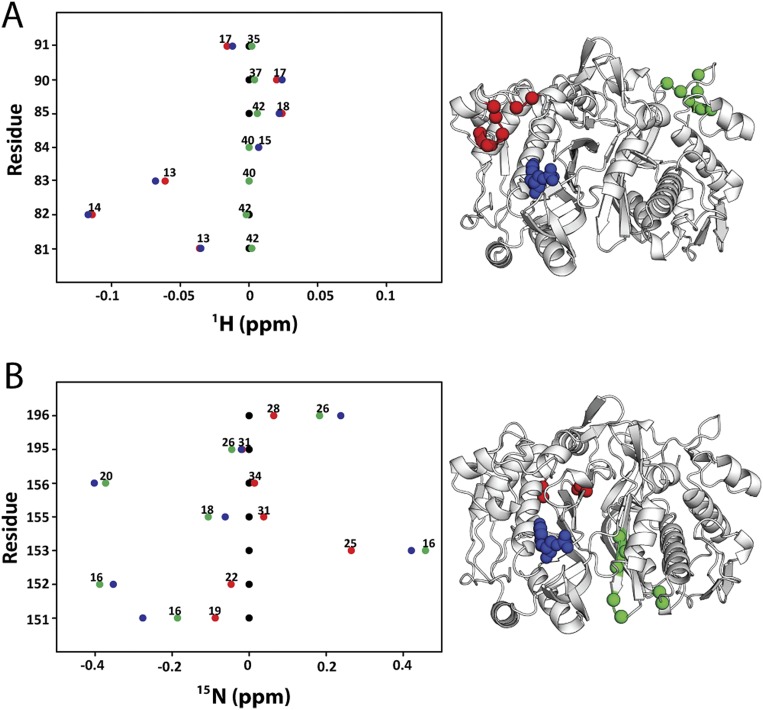
Fig. S4.
Line plots of 1H and 15N chemical shifts. 1H and 15N chemical shift differences are plotted for apo (black), dUMP2 (blue), dUMP1bound (red), and dUMP1empty (green). Each of the dUMP1 points is labeled with the distance of that residue (red and green spheres on the structure) from the bound dUMP (blue spheres on the structure). Distances are measured from the amide N to the centroid of the bound dUMP. (A) Residues that are distal from the interface (81–91) show expected behavior where proximal residues are perturbed by dUMP with no effect on the distal residues. The agreement of the dUMP1 peaks with the apo or dUMP2 peaks also shows that the observed extreme behaviors (Fig. 5) are intrinsic behaviors of the protein. (B) 15N chemical shifts for residues in Fig. 5A show that the observed behaviors are not nucleus-specific.

