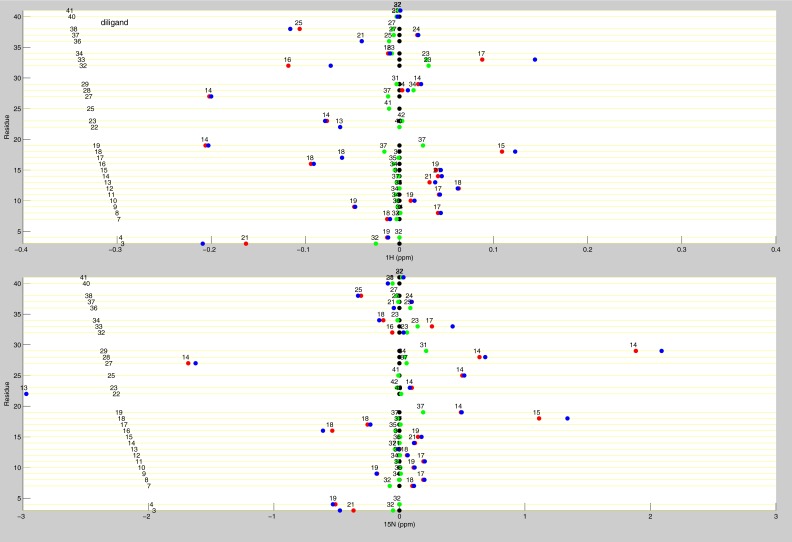
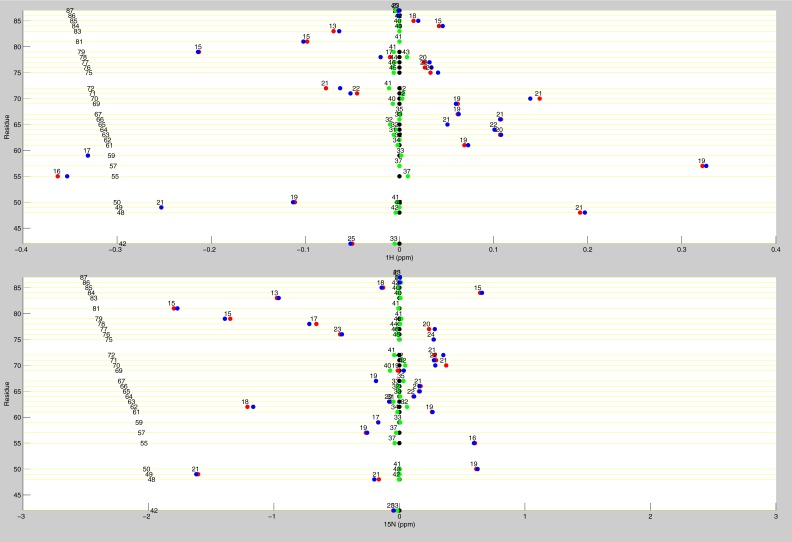
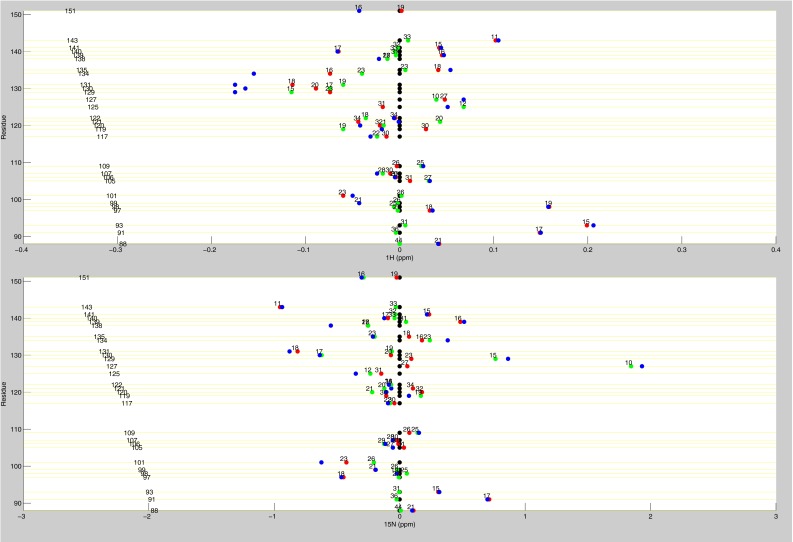
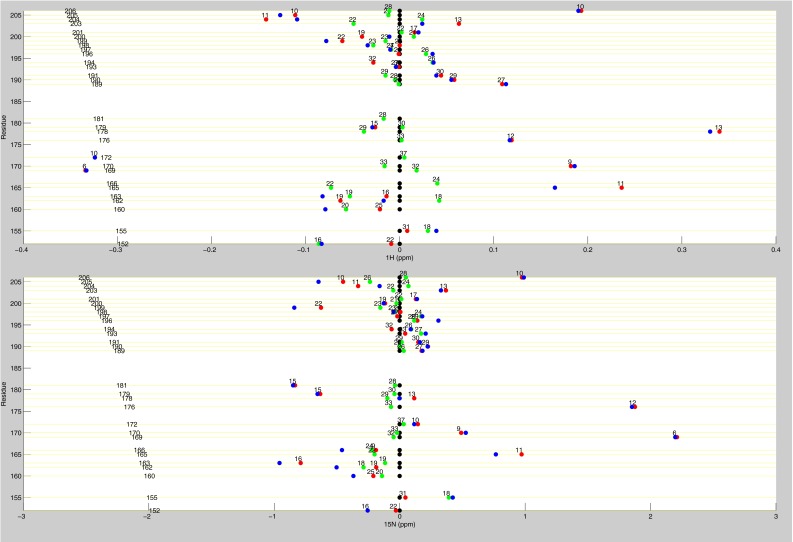
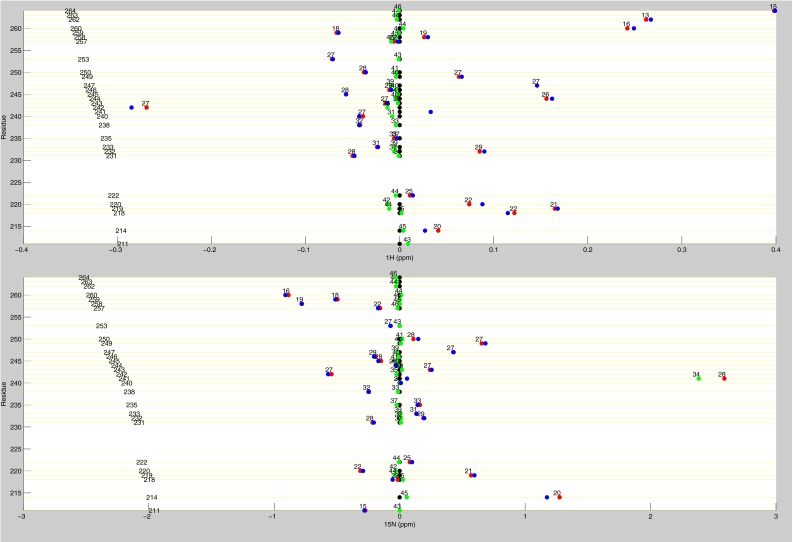
Fig. S7.
Line plots of diligand 1H and 15N chemical shifts. These line plots show the chemical shift behavior for diligand binding for all available residues of TS. 1H and 15N chemical shift differences are plotted for apo (black), diligand2 (blue), diligand1bound (red), and diligand1empty (green). Each of the diligand1 points are labeled with the distance (in Å) of that residue from the bound dUMP. Distances are measured from the amide N to the centroid of the bound dUMP.

