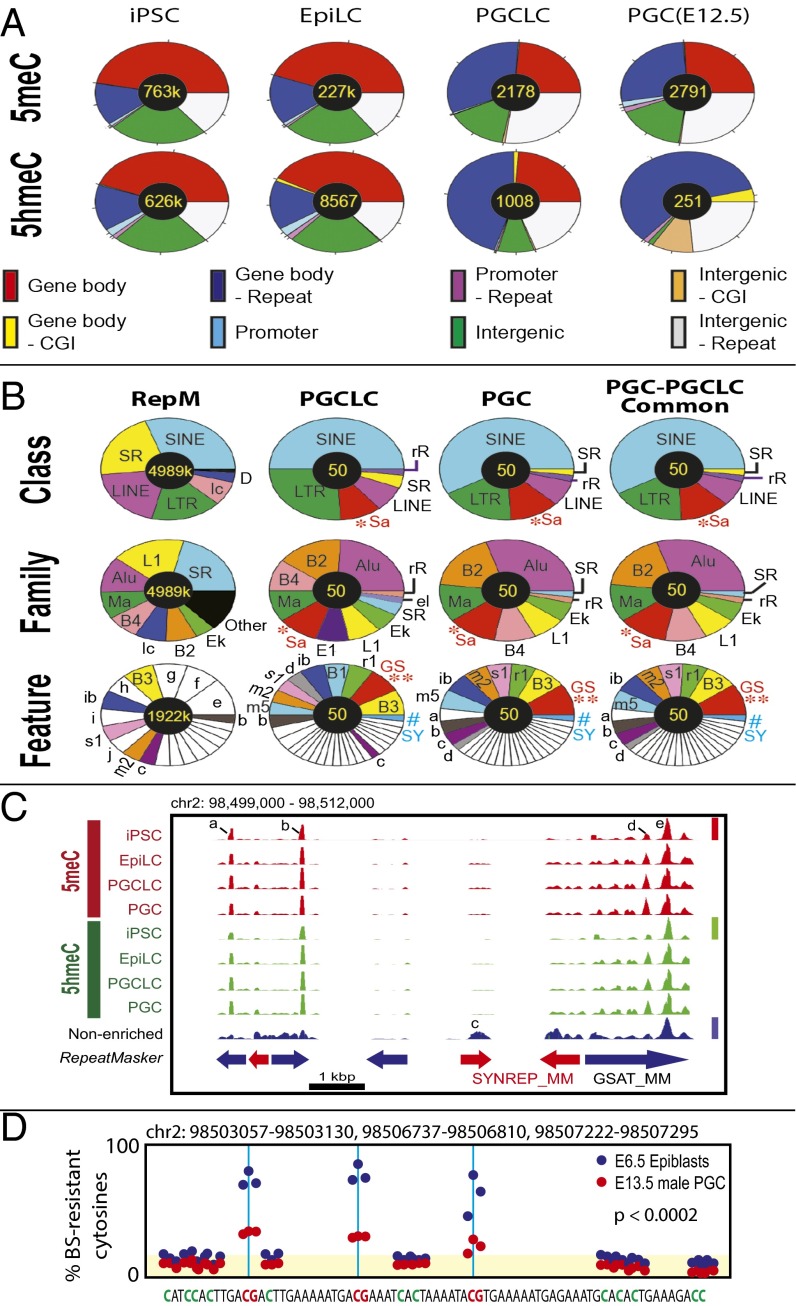
Fig. 3.
Genomic feature distributions of 5meCs and 5hmeCs in the genomic DNA of mouse iPSCs, EpiLCs, PGCLCs, and in vivo PGCs. (A) 5meC and 5hmeC distributions across genomic features. (B) Distributions of 5meCs across repeat sequences. RepM, genome-wide RepeatMasker-registered elements. Small elements (<5%) are left blank in pie charts. *Sa, satellite repeats; **GS, GSAT_MM; #SY, SYNREP_MM. Other keys of pie charts are defined in Fig. S5. (C) An example of deep-sequencing tracks showing 5meC and 5hmeC peaks at GSAT_MM and SYNREP_MM satellite repeats. Height of peaks reflects relative strength of DNA methylation across the four 5meC tracks (linearly scaled 0–1 between the baseline and the maximal methylation, red bar), DNA hydroxymethylation (four 5hmeC tracks, green bar), or nonenriched genome resequencing (blue bar); note that scaled value 1 is not equal to 100% methylation. Peaks a, b, and d are “informative” based on their enrichment over the nonenriched mouse genome resequencing track or changes between different types of cells. Peaks c and e are present in the nonenriched track and so are uninformative. (D) Reanalysis of the whole-genome bisulfite sequencing data generated by Seisenberger et al. (9) for a 74-nt sequence repeated three times in the GSAT_MM regions shown in C. Blue and red dots show percentage of bisulfite-resistant cytosines in E6.5 epiblasts and E13.5 PGCs, respectively. Yellow shade indicates the background levels of bisulfite-resistant cytosines in CpA, CpT, and CpC dinucleotides. The P values represent statistical significance between the CpG-context bisulfite-resistant cytosines over the background (t test).

