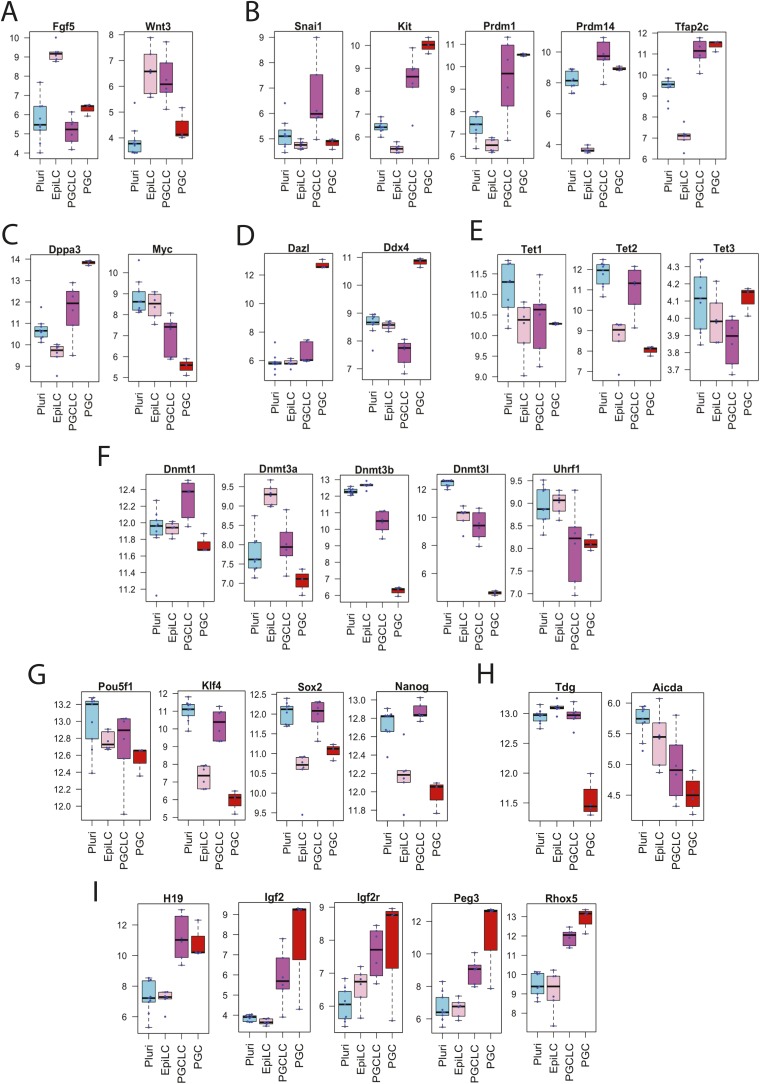
Fig. S2.
mRNA expression of marker genes in mouse PSCs, EpiLCs, PGCLCs, and E12.5 in vivo PGCs. Box plots represent median, first and third quartile, and 95% confidence intervals of mRNA expression (normalized intensity values) determined using Affymetrix microarray (n > 3). (A) Epiblast markers. (B–D) PGC markers for (B) early, (C) mid, and (D) late stages. (E) Tet enzymes. (F) DNA methyltransferases and the Uhrf1 cofactor of DNMT1. (G) Pluripotency genes. (H) Enzymes involved in active demethylation of DNA. (I) Imprinted genes.

