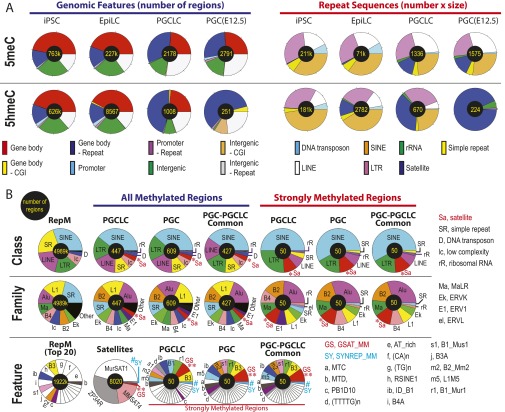
Fig. S5.
Distributions of 5meCs and 5hmeCs across genomic features in mouse PSCs, PGCLCs, and in vivo PGCs. Numbers of total features are shown at the center of each pie chart. (A) 5meC and 5hmeC distributions in all genomic features (Left; reflecting numbers of regions only) and in repeat sequences (Right; reflecting products of numbers and sizes of regions). (B) Detailed distributions of 5meC in repeat sequences based on numbers of regions. RepM, profiles of the entire RpeatMasker elements. RepeatMasker features are integrated into families, which are further integrated into classes. Some of the small RepeatMasker features (<5%) are shown as blanks without labels.

