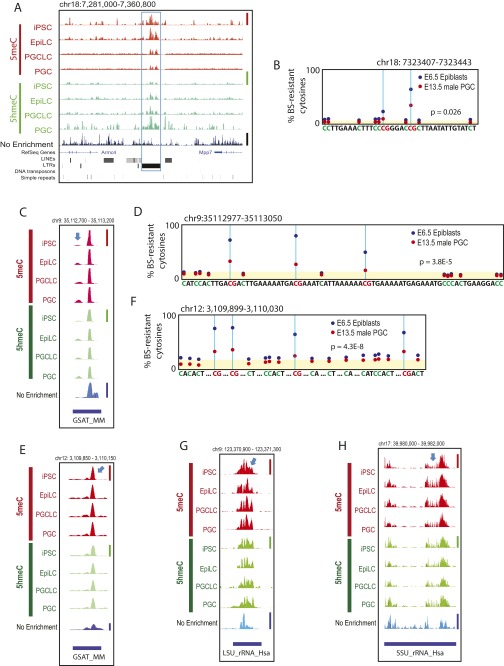
Fig. S7.
Examples of 5meC and 5hmeC retention in PGCLCs and PGCs. A, C, E, G, and H show deep-sequencing tracks at (A) an IAP, (C and E) GSAT_MM, (G) LSU_rRNA_Hsa, and (H) SSU_rRNA_Hsa. Informative peaks are indicated by blue arrows. Height of peaks reflects relative strength of DNA methylation across the four 5meC tracks (linearly scaled 0–1 between the baseline and the maximal methylation in the displayed area indicated by a red vertical bar at the right), DNA hydroxymethylation (four 5hmeC tracks, green vertical bar), or nonenriched genome resequencing coverage (nonenriched track, blue vertical bar); note that scaled value 1 is not equal to 100% methylation. (B, D, and F) Reanalysis of the whole-genome bisulfite sequencing data generated by Seisenberger et al. (9) for E6.5 mouse epiblasts and E13.5 male PGCs corresponding to sequencres shown in A, C, and E, respectively. Yellow shading indicates the background levels of bisulfite-resistant cytosines in CpA, CpT, and CpC dinucleotides. The P values represent statistical significance between the CpG-context bisulfite-resistant cytosines over the background (t test).

