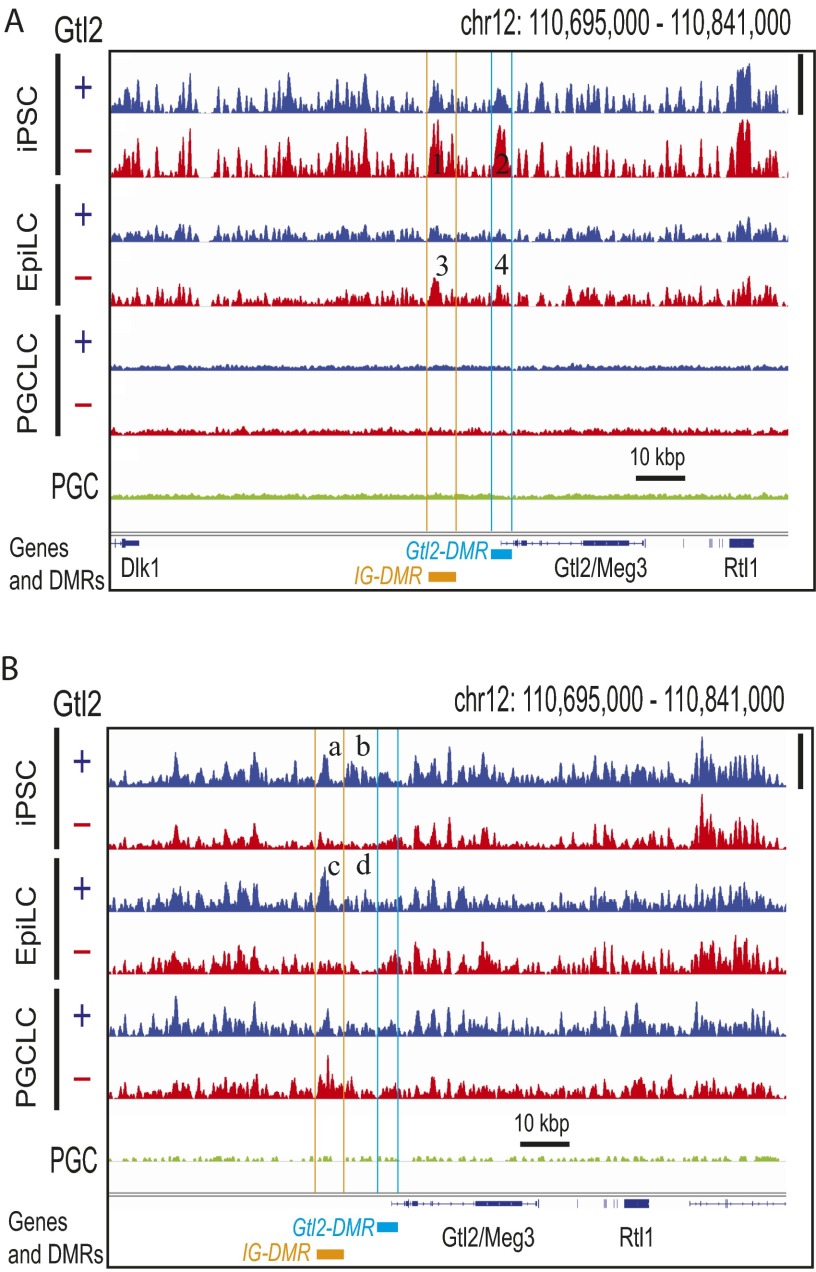
Fig. S9.
Erasure of DNA hypermethylation at the IG-DMR and Gtl2-DMR of Gtl2(−) iPSCs during differentiation to PGCLCs. Deep-sequencing tracks of 5meCs (A) and 5hmeCs (B) in the genomes of Gtl2(+) and Gtl2(−) mouse iPS cells and their EpiLC and PGCLC derivatives are shown. Height of peaks reflects relative strength of DNA methylation (A) or hydroxymethylation (B) across all seven tracks in each panel, linearly scaled between the baseline and the maximal methylation in the displayed area shown with vertical bars at right. Orange and cyan lines indicate locations of IG-DMR and Gtl2-DMR, respectively. Numbers 1–4 show differential methylation between Gtl2(+) and Gtl2(−) iPSCs and EpiLCs at the DMRs. (a–d) Differential hydroxymethylation. Note that regions b and d locate between the two DMRs.

