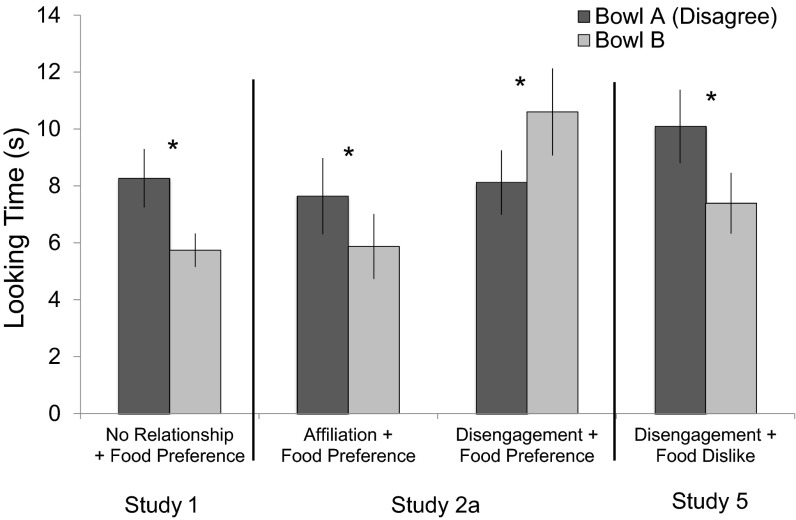
Fig. 3.
Looking times for Studies 1, 2a, and 5. This graph depicts the average looking time to bowl A and bowl B trials for infants in the food conditions of studies 1, 2a, and 5. Error bars represent the SEM looking time. Asterisks indicate a significant difference in the individual ANOVAs for each condition.

