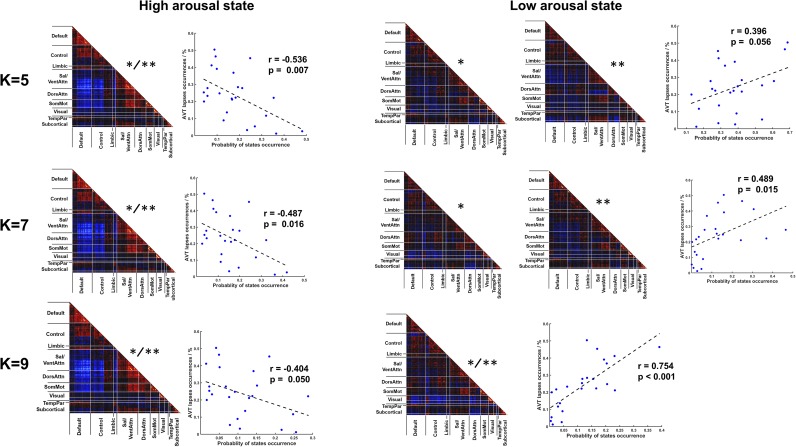
Fig. S6.
Occurrence of high- and low- DCS correlated with individual differences in AVT task performance. Results obtained using k-means clustering at k = 5, 7, and 9. Two asterisks (**) represent task-based DCS best matched to high- or low-arousal DCS derived from task-free fMRI; a single asterisk (*) represents task-based DCS that predicted intersubject AVT performance.

