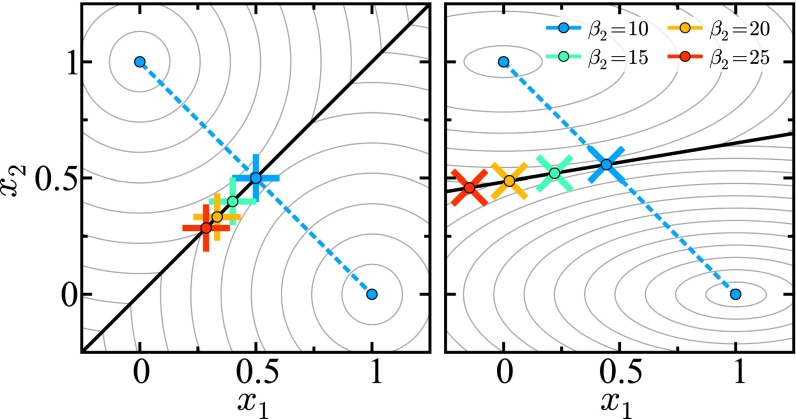
Fig. 4.
Contour plots of energy surfaces for symmetric (Left) and asymmetric (Right) donor–acceptor pair geometries. The CL is shown as a thick black line. The crosses mark the point of maximum probability for the a→b transition on the CL for with held constant. The dashed line connects the two well minima through the geometrical minimum energy point.

