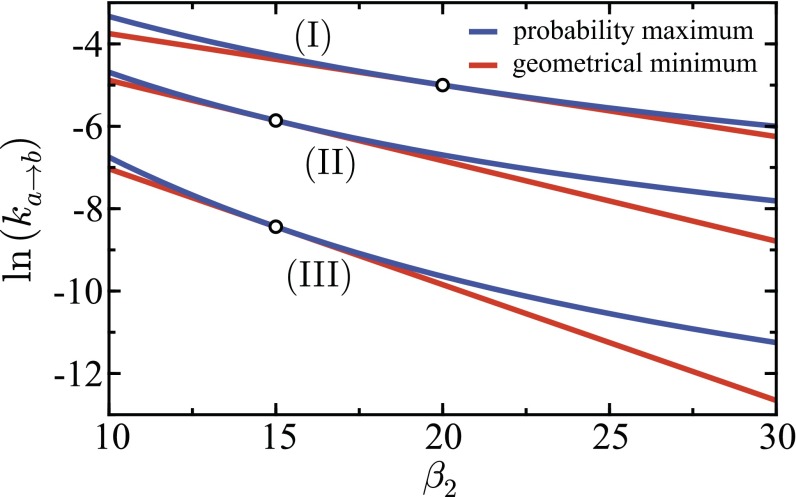
Fig. S1.
ET rate given by the geometrical energy minimum (red line) and probablity maximum (blue line) shown as function of with held constant. Parameters are (I) , (II) , and (III) . The circular markers denote the points where . Other parameters are . Preexponential factors in the rate expressions have been suppressed.

