Significance
With ongoing public concern regarding climate change and recent drought that has affected many areas of the western United States, this study provides context and direct evidence for the negative impact of water stress on forest ecosystems. The response of trees to drought is a tangible example of the impacts of climate change on terrestrial ecosystems and is understandable by the public and a broad scientific audience. Any sustained change in the growth rates of trees also affects carbon sequestration, biodiversity maintenance, and ecosystem resilience, influencing both productivity and susceptibility to other disturbances.
Keywords: actual evapotranspiration, dendrochronology, Douglas fir, drought, vapor pressure deficit
Abstract
Changes in tree growth rates can affect tree mortality and forest feedbacks to the global carbon cycle. As air temperature increases, evaporative demand also increases, increasing effective drought in forest ecosystems. Using a spatially comprehensive network of Douglas fir (Pseudotsuga menziesii) chronologies from 122 locations that represent distinct climate environments in the western United States, we show that increased temperature decreases growth via vapor pressure deficit (VPD) across all latitudes. Using an ensemble of global circulation models, we project an increase in both the mean VPD associated with the lowest growth extremes and the probability of exceeding these VPD values. As temperature continues to increase in future decades, we can expect deficit-related stress to increase and consequently Douglas fir growth to decrease throughout its US range.
Declines in forest growth contribute to reduced net primary productivity and alter the global carbon cycle (1, 2). Decreased tree vigor also can predispose or increase the sensitivity of forests to disturbances and stress, such as bark beetle-induced mortality (3), related fine fuel accumulation, and short-term wildfire hazard (4), and potential mortality associated with low soil moisture (5, 6). Collectively, these changes have concomitant impacts on ecosystem processes and function (7). Changes in tree growth are often attributed to climatic variability (8, 9), wherein periods of anomalously warm and dry conditions (i.e., water stress or drought) result in decreased annual tree growth (10).
Plant water stress is a combined function of water supply and demand. Increased air temperature exacerbates water stress by increasing deficits in both the soil and atmosphere. As water and atmospheric deficits increase, trees can lose water via the soil–plant–atmosphere continuum, resulting in increased stress (11), or eventually close stomata, ceasing growth altogether (5). Increased precipitation can ameliorate water stress to some degree, but on seasonal and longer time scales the impact of temperature-induced increases in evaporative demand can outweigh precipitation inputs and increase water stress in forest ecosystems (12, 13).
Measurements of precipitation and temperature are useful indicators of climate at any given time but, unlike “plant-relevant” variables, do not directly reflect the energy and water balance of terrestrial systems (14). Variables that express how plants “sense” climate are more useful in analyses that consider climatic limitations on plant growth and distributions (13, 15). Climatic water deficit (DEF), calculated as potential evapotranspiration (PET) minus actual evapotranspiration (AET), measures climate as the interaction of water (precipitation) and energy (temperature) (14). High DEF values indicate time periods when the evaporative demand of plants is not met by available soil moisture. Vapor pressure deficit (VPD), another plant-relevant variable, is a function of relative humidity and temperature. VPD increases with temperature, and high VPD levels indicate periods when atmospheric deficits are so high that plants either lose water at faster rates as a reaction to steep water-potential gradients or close stomata. DEF and VPD are variables that integrate water and energy and are sensitive to temperature increases (13).
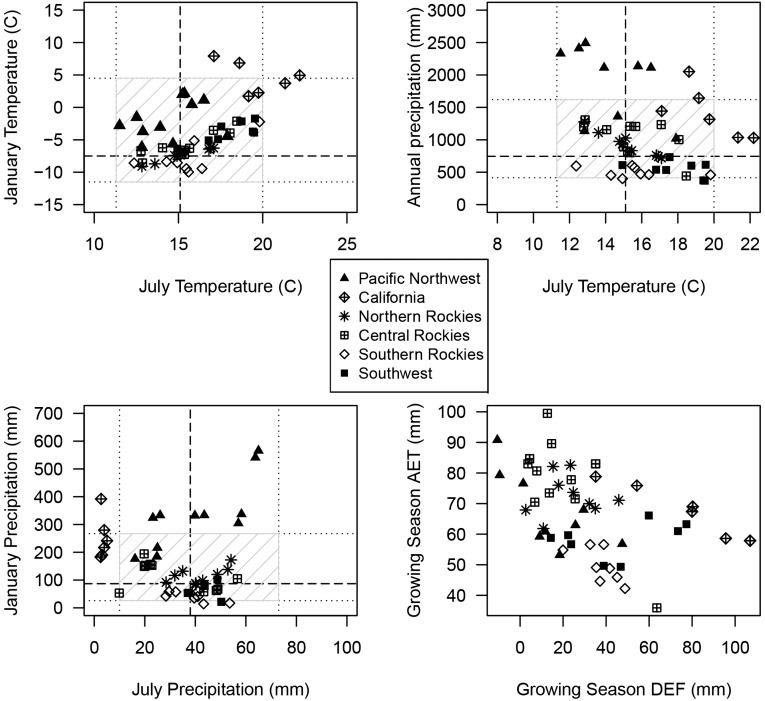
We quantified the relationship between climate and Douglas fir growth in forests throughout the western United States. Douglas fir, which occupies diverse landscapes from sea level to 3,300 m and a broad range of climate regimes (Fig. S1 and Table S1), is one of the most ecologically and economically important coniferous species in western US forests. Our network of 122 tree-ring-width chronologies represents tree growth in a breadth of growing environments and climates (Fig. 1 and Fig. S1). This work builds on previous efforts to assess climate–growth relationships at regional scales (9, 13, 16) but expands to the realized climatic niche of the species rather than using data from the International Tree-Ring Data Bank, which largely represents extreme growing environments (13, 17). We therefore avoid any sampling bias inherent in chronologies intended for climatic reconstruction (18), and our results pertain to a much broader range of environments. Here, we analyze a comprehensive network of growth data sampled specifically to assess the relationship between climate and tree growth. We use historical (1916–2006) and model-projected future hydroclimates (climatologies centered on the 2040s and 2080s) from the Variable Infiltration Capacity hydrologic model (19, 20), which includes DEF, VPD, temperature, and precipitation to evaluate climate–growth relationships.
Fig. S1.
Distribution of sampling sites in climate space. The climatic limits of Douglas fir (34) are represented as 10th and 90th percentiles (dotted lines) and 50th percentiles (dashed line). The hatched box symbolizes the fundamental climate niche of Douglas fir. Sampling sites are plotted in this climate space based on average values (1916–2006) of the variables indicated. The distribution of sample sites represents the realized climate niche of Douglas fir.
Table S1.
Locations and mean annual climate parameters for all study watersheds
| Region | State | No. of trees | Property name | Latitude | Longitude | Elevation, m | Annual precipitation, cm | Annual maximum temperature, °C | Annual minimum temperature, °C |
| Pacific Northwest | Washington | 76 | North Cascades National Park | 48.94038 | −121.40010 | 1,048 | 197 | 10.0 | 1.1 |
| Pacific Northwest | Washington | 70 | Olympic National Park | 47.74623 | −123.20605 | 1,031 | 188 | 10.5 | 2.3 |
| Pacific Northwest | Washington | 72 | Olympic National Park | 47.82603 | −123.99620 | 531 | 337 | 14.0 | 4.9 |
| Pacific Northwest | Washington | 67 | North Cascades National Park | 48.30747 | −120.65660 | 989 | 106 | 11.5 | 1.2 |
| Pacific Northwest | Oregon | 85 | HJ Andrews Experimental Forest | 44.23159 | −122.13355 | 1,179 | 235 | 13.7 | 3.0 |
| Northern Rockies | Montana | 81 | Glacier National Park | 48.58777 | −113.88410 | 1,323 | 87 | 10.4 | −1.6 |
| Northern Rockies | Montana | 68 | Glacier National Park | 48.49320 | −113.35914 | 1,727 | 101 | 8.7 | −1.4 |
| Northern Rockies | Idaho | 70 | Idaho Panhandle National Forest | 48.98723 | −116.62731 | 1,177 | 84 | 10.7 | 0.7 |
| Northern Rockies | Idaho | 71 | Idaho Panhandle National Forest | 48.82964 | −116.46036 | 1,258 | 89 | 10.5 | 1.0 |
| Central Rockies | Idaho | 72 | Payette National Forest | 45.13659 | −116.41832 | 1,911 | 120 | 10.3 | −2.2 |
| Central Rockies | Montana | 92 | Gallatin National Forest | 45.87449 | −110.89657 | 1,986 | 71 | 10.0 | −3.2 |
| Central Rockies | Oregon | 31 | Umatilla National Forest | 44.99897 | −118.98660 | 962 | 43 | 16.6 | 1.3 |
| Central Rockies | Oregon | 74 | Wallowa-Whitman National Forest | 45.71603 | −117.40513 | 1,689 | 130 | 10.4 | 0.5 |
| Southern Rockies | Wyoming | 83 | Bridger-Teton National Forest | 43.48059 | −110.70658 | 2,300 | 69 | 10.0 | −3.3 |
| Southern Rockies | Colorado | 89 | Gunnison National Forest | 38.44524 | −106.36330 | 2,988 | 65 | 10.0 | −4.6 |
| Southern Rockies | Colorado | 59 | Roosevelt National Forest | 40.42530 | −105.32592 | 2,145 | 47 | 14.8 | 0.9 |
| California | California | 72 | UC Angelo Reserve | 39.72647 | −123.63349 | 527 | 209 | 19.5 | 5.6 |
| California | California | 57 | BLM Headwaters Reserve | 40.64037 | −124.07719 | 485 | 150 | 18.6 | 7.5 |
| California | California | 91 | Plumas National Forest | 39.94591 | −121.09904 | 1,405 | 117 | 17.6 | 3.6 |
| California | California | 41 | Stanislaus National Forest | 37.97359 | −120.07321 | 1,282 | 111 | 18.9 | 5.2 |
| Southwest | Arizona | 40 | Grand Canyon National Park | 36.24806 | −112.04188 | 2,526 | 65 | 14.2 | −0.2 |
| Southwest | New Mexico | 74 | Valles Caldera National Preserve | 35.98106 | −106.59204 | 2,850 | 69 | 11.7 | −1.1 |
| Southwest | New Mexico | 30 | Chama River Wilderness | 36.27471 | −106.61508 | 2,424 | 52 | 15.2 | 1.7 |
| Southwest | Utah | 43 | Henry Mountains | 38.06987 | −110.79483 | 2,920 | 73 | 11.0 | −2.0 |
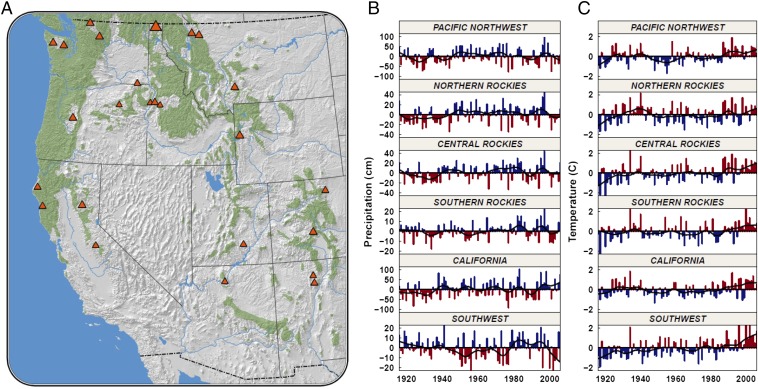
Fig. 1.
Distribution of study sites (A) and climate anomalies (B and C) in the western United States. (A) The range of Douglas fir is depicted in green; the size of triangles depicts the density of sample plots. (B and C) Precipitation anomalies (B) and temperature anomalies (C) for study regions. A clear positive trend in temperature is evident, whereas no trend in precipitation exists.
Results and Discussion
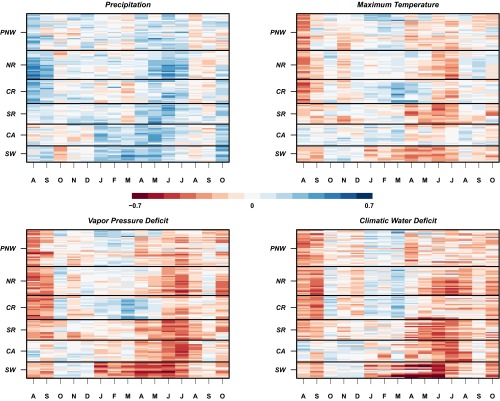
For the period 1916–2006, growth was positively correlated (Pearson’s r ≥ 0.2, P = 0.05, n > 91) with precipitation and was negatively correlated (Pearson’s r ≤ −0.2, P = 0.05, n > 90) with temperature, VPD, and DEF in the growing season (April–July, hereafter “AMJJ”) (Fig. 2), and correlations were much higher for the last two variables. Correlations with precipitation and temperature mirror one another: Higher temperatures decrease growth in the same months that precipitation enhances growth, so it is difficult to attribute the effect of one variable or the other. Conversely, VPD and DEF have a much stronger relationship with growth (Pearson’s r ≤ −0.5, P ≤ 0.001) than with precipitation, suggesting that these integrated climatic variables better represent the growth-limiting mechanisms of climate.
Fig. 2.
Correlations between monthly climate and annual growth at the plot scale. Colors represent Pearson’s correlations between plot-scale chronologies and monthly climate variables, ranging from −0.7 (red) to 0.7 (blue). The x axis denotes months spanning August of the previous year to October of the current growing season. Plots are ordered within each region from high (top) to low elevation. During the growing season (AMJJ), growth is tightly linked to climate with a strong negative relationship among growth, VPD, and DEF. Precipitation and temperature, although significant in the growing season, are less correlated with growth. PNW, Pacific Northwest; NR, northern Rockies; CR, central Rockies; SR, southern Rockies; CA, California; SW, Southwest. Correlation coefficients greater than 0.2 and less than −0.2 are significant at α = 0.05.
A consistent negative relationship exists between growth and VPD in June and July across all regions, with correlation magnitude decreasing but still significant as latitude decreases (Fig. 2). The strength of growth–climate relationships differs in timing and by the length of the growing season. Growing season deficits decrease tree growth, but a lagged relationship is also evident in which previous-year late-summer temperature and deficits decrease growth in all regions except California (Fig. 2). These lagged responses are well known, have been established in the scientific literature (8, 9), and provide evidence that climate can affect growth for more than one season, probably because growing conditions alter carbon fixation and bud production. The influence of nongrowing season and previous-year climate increases with latitude, and correlations with these variables are higher in regions where, historically, water stress appears less limiting. It is worth noting that tree height-driven variation in stomatal sensitivity to VPD has been observed within Douglas fir stands (21), and therefore there is some potential for physiological or morphological adaptation responses to increased VPD. However, warmer temperatures will almost certainly increase the duration and magnitude of water stress in the south and will alter the timing of limiting factors in the north as water stress becomes a more important limiting factor.
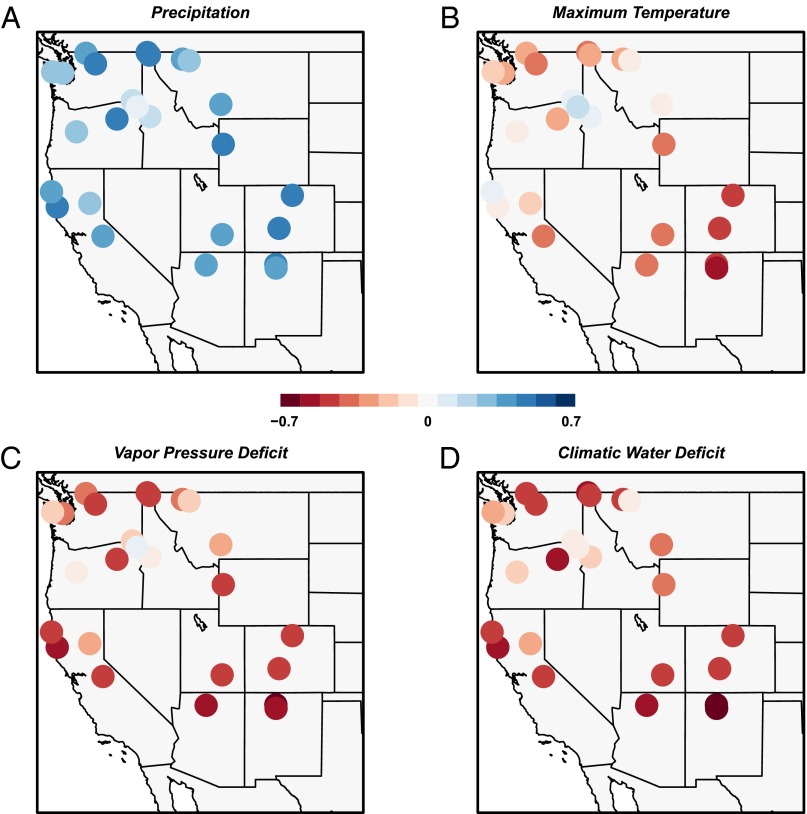
The growing-season months (AMJJ) were aggregated into one climate variable and correlated with watershed-scale chronologies (Methods, Chronology Development and Fig. 3) to test if the relationships varied with spatial scale. Correlation coefficients increased in strength for all variables, reinforcing the inference that high deficits during growing-season months drive reductions in tree growth at the plot and watershed scales (Fig. 3). Fine-scale variability in climate response can likely be attributed to genetic variability (22), morphology and physiology (21), soils, and landscape position, but coarse-scale patterns support the conclusion that Douglas fir is sensitive to atmospheric and soil moisture deficits across spatial and temporal scales.
Fig. 3.
Watershed-scale relationships between climate and tree growth. Colors represent Pearson’s correlations between watershed-scale chronologies and growing season (AMJJ) climate variables, ranging from −0.7 (red) to 0.7 (blue). Panels depict total precipitation (A), mean maximum temperature (B), total VPD (C), and total DEF (D). Correlation coefficients greater than 0.2 and less than −0.2 are significant at α = 0.05. Correlations between growth and AMJJ climate are stronger than monthly correlations. C and D show the stronger relationships produced when using plant-relevant variables.
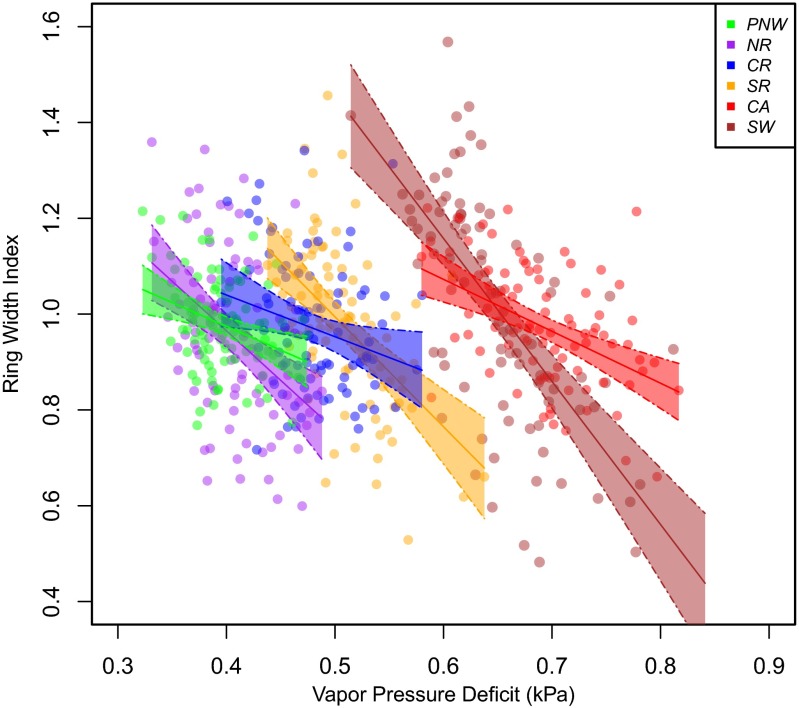
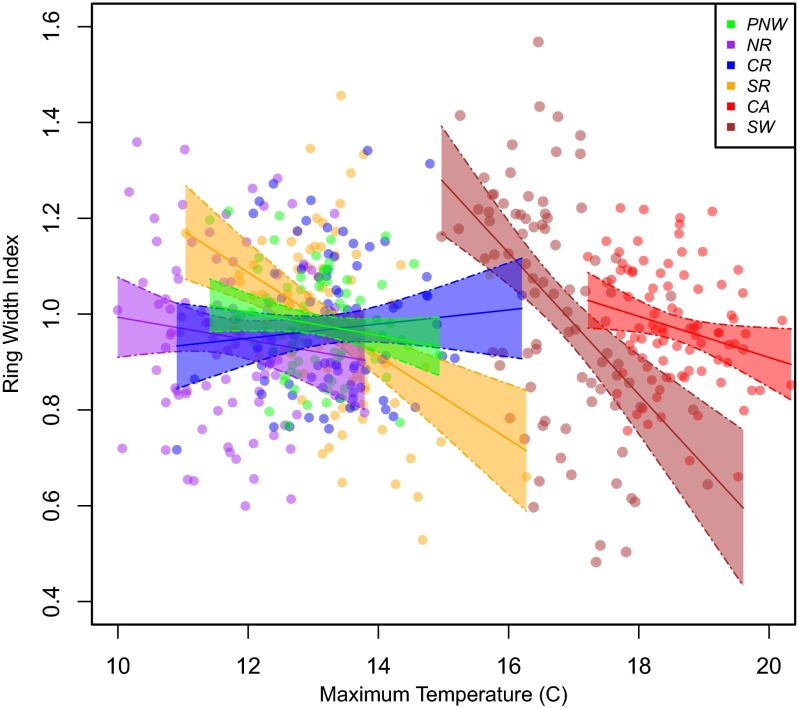
Our results corroborate the effects of VPD on forest drought stress documented for forests in the southwestern United States (13). Our data suggest that a strong relationship exists between VPD and growth throughout Douglas fir forests of the western United States: Low growth is associated with high VPD when analyzed at the regional scale (Fig. 4). Our work expands on work conducted by Williams et al. (13), in that we investigated the entire population of a species, making these results more applicable to a broader range of conditions (13). Regressions conducted for the direct effect of temperature on growth have significant downward slopes only in the southern latitudes (Fig. S2), suggesting that temperature alone decreases growth only in some cases, whereas VPD decreases growth in all regional cases. More generally, the mean VPD associated with the lowest 10th percentile of growth is higher than the mean VPD (Fig. 5D), suggesting that VPD is the dominant driver of the low growth.
Fig. 4.
Ring width decreases with increasing VPD. VPD values are annual totals. Solid lines represent linear regression models with 95% confidence intervals (shaded colors). All slopes are significant: Southwest (SW), β = −2.985, P < 0.001; California (CA), β = −1.084, P < 0.001; southern Rockies (SR), β = −2.295, P < 0.001; central Rockies (CR), β = −0.8704, P = 0.023; northern Rockies (NR), β = −2.068, P < 0.001; Pacific Northwest (PNW), β = −0.994, P = 0.002.
Fig. S2.
Temperature alone decreases tree growth only in the southern latitude regions. Solid lines represent linear regression models with 95% confidence intervals (shaded colors). Only southern latitude slopes are significant: Southwest (SW), β = −0.147, P < 0.001); California (CA), β = −0.043, P = 0.032; southern Rockies (SR), β = −0.087, P < 0.001; central Rockies (CR), β = 0.015, P = 0.403; northern Rockies (NR), β = −0.024, P = 0.302; Pacific Northwest (PNW), β = −0.024, P = 0.116.
Fig. 5.
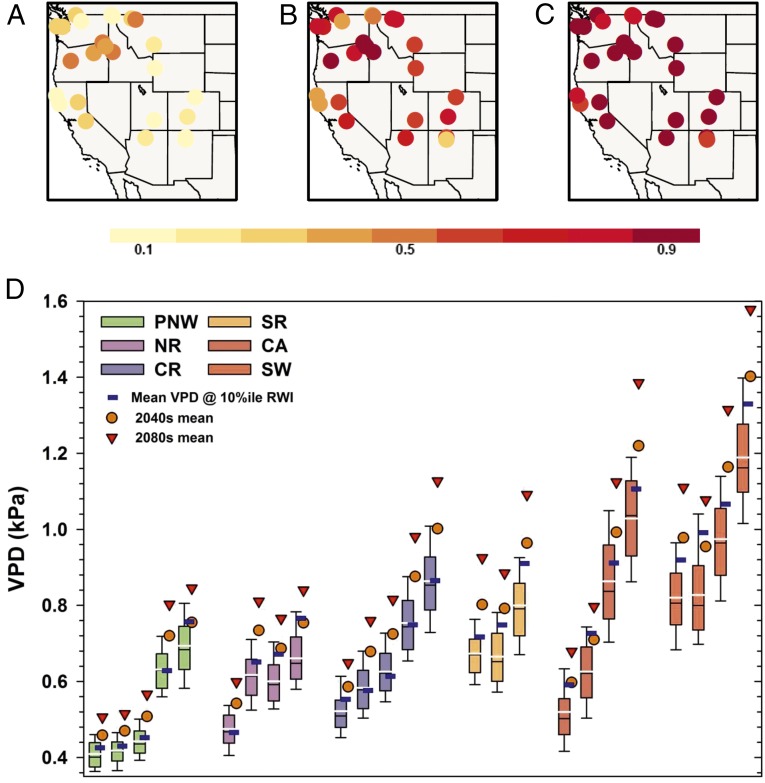
Douglas fir growth in a future climate. Historical and future mean growing season (AMJJ) VPD associated with 10th percentile Douglas fir growth and exceedance probability under future climate scenarios. (A) Historical probability. (B) 2040s. (C) 2080s. (D) Box-and-whisker plots represent the site-scale VPD. Black lines indicate the median; white lines indicate the mean; blue squares indicate mean values associated with 10th percentile growth. Each box-and-whisker plot represents an individual study site. Sites are ordered by elevation, from high to low. As shown in A, the historical probability of exceeding the 10th percentile mean is relatively low and variable (0.12–0.53). Future climate scenarios project increases in the mean that greatly exceed the historical range of variability (D), and by the 2080s the exceedance probability increases to 0.66–1.0 (C).
Although both high temperature and VPD decrease growth, the physiological mechanisms differ between these climate variables. The effect of high temperature alone would cause growth to decrease as a function of biochemical limitations to growth, because photosynthesis decreases once leaf temperatures exceed a given threshold (23, 24). However, when VPD reduces growth, moisture stress results in stomatal closure, which ultimately decreases growth because of reduced CO2 uptake (25). VPD is one of the most important climate variables linked to variation in stomatal closure (26), with stomatal conductance decreasing exponentially as VPD increases (27). VPD limits growth across all latitudes, whereas temperature alone is limiting only in the southernmost sites, suggesting a latitudinal gradient of limiting factors. We hypothesize that higher temperatures may drive stomatal closure (via water stress) in the northern latitudes, and a combination of stomatal closure and biochemical limitations inhibits photosynthesis in southern latitudes.
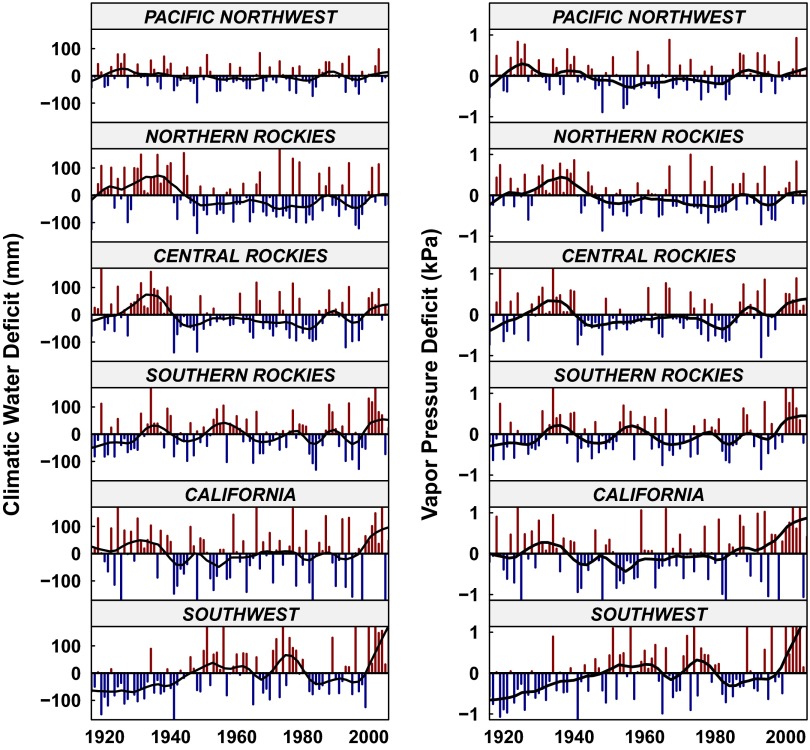
Our results illustrate that forests are sensitive to changes in VPD and DEF, which reflect the relationship between temperature and precipitation in terrestrial ecosystems. Temperature, VPD, and DEF have increased across all study regions since 1980 (Fig. 1 and Fig. S3) and are projected to increase throughout western North America (28). Model projections are uncertain regarding precipitation but suggest that precipitation will not increase substantially during the growing season compared with historical variability. Both deficit variables are sensitive to temperature, so if temperature increases, especially with no increase in precipitation or relative humidity, deficits will increase. Warmer growing-season temperatures therefore can be expected to increase the duration of stressful growing conditions and the frequency of low-growth conditions. To evaluate these increases, we modeled future changes (derived from Global Circulation Models projections of climate) in mean VPD associated with the lowest 10th percentile of growth (Fig. 5D) and the probability of exceeding those mean values (Fig. 5 A–C). By examining the lowest percentile of growth, we are able to calculate the range of VPD that is most strongly linked to low growth. The mean 10th percentile VPD is projected to increase well outside the historical distribution for all regions, and the probability of these conditions increases to 0.66–1.0 by the 2080s (Fig. 5). As conditions associated with low growth increase, we should expect to see similar declines in growth, as observed under adverse growth conditions in the historical record. The combination of increased duration and frequency of anomalously low growth could result in novel ecosystem responses.
Fig. S3.
DEF and VPD anomalies. Fitted lines are loess-smoothed curves with a 13-y segment length. Interannual variability is lowest in the Pacific Northwest and increases toward the Southwest. Recent increases are most evident in the more southerly regions.
As temperatures increase in forested regions throughout the western United States, growth will decrease commensurate with observed decreases in historical warm periods, outweighing a potential fertilization effect that higher ambient CO2 concentration may have on tree growth (29). The principle of limiting factors suggests that tree growth can proceed only as fast as allowed by the primary variables that limit growth (30) and that nonstationarity in climate change can create a set of transient most-limiting factors. Once demands for CO2 are met, the down-regulation of photosynthesis occurs in response to other limiting factors (i.e., water, nutrients, and light) (31). Water is the principal limiting factor in most of the range of Douglas fir. Growth and productivity therefore will decrease in these and other potentially water-limited forests in response to a warmer climate.
Methods
Acquisition of Tree Cores.
We used a sampling approach that focused on both the climate space and geographic extent of Douglas fir (Fig. S1). The species range was divided into regions that served as “climate domains,” based on an analysis of historical climatic data derived from the Variable Infiltration Capacity (VIC) hydrologic model (19, 20). After summarizing the data in terms of magnitude and seasonal timing of precipitation, Douglas fir distribution was divided into six regions: Pacific Northwest, California, northern Rockies, central Rockies, southern Rockies, and Southwest. The climate domain delineation corresponds closely to Bailey’s ecoprovince divisions used nationwide (32), so we are confident that these regions are representative of reasonable climatic zones across the Douglas fir range. In each region, we selected watersheds and placed plots (within each watershed) on opposing aspects at different elevations to account for topographic complexity.
In each plot, we sampled 15 trees in either dominant or codominant canopy positions with no signs of pathogens, insects, or injuries. All trees were a minimum of 125 y old at breast height; this age threshold was used to avoid the inclusion of the juvenile portion of growth in the time series. One core was extracted from the side-slope of each tree, diameter was measured at breast height, and each plot was georeferenced with a handheld Global Positioning System device.
The tree-core data were combined with data from Littell et al. (9) to create a robust dataset that covers the entire geographic range of Douglas fir in the United States. To match the sampling density of the new plots in geographic space, we subsampled watersheds in each of the study sites, retaining two watersheds from each sample site and all plots in the chosen watersheds. Instead of a random sample of watersheds, we chose an informed sampling approach because our sampling strategy was designed to control for nonclimatic factors (i.e., elevation and aspect) that may mediate the tree response to regional climate. We calculated the growing season (April–September) water deficit (PET − AET) for each watershed and then graphically compared these values with those of other watersheds in the site. This approach allowed us to choose watersheds based on a range of water availability, from deficit (PET > AET) to surplus (PET − AET = 0, often because precipitation > PET) in growing-season months, resulting in paired watersheds of wet vs. dry and/or warm vs. cool. Watersheds whose deficit values differed only slightly were evaluated based on tree age and temporal resolution.
The distribution of sampled sites in climate space was visualized by plotting the geographic locations of plots based on their respective climatologies (Fig. S1). We used the climate parameters described by Thompson et al. (33) because they have been used previously to define the climatic limits of Douglas fir distribution. Climate variables are January temperature (expressed in degrees Centigrade), July temperature (expressed in degrees Centigrade), and annual precipitation (expressed in millimeters), all derived from VIC model output. Climate space was also visualized using the plant-relevant variables growing-season evapotranspiration (expressed in millimeters) and growing-season deficit (expressed in millimeters).
Climate Data and Projections.
We used VIC model output, which uses daily climatic data extracted from the Historical Climate Network and Cooperative Observer Networks (available online at cdiac.ornl.gov/epubs/ndp/ushcn/ushcn.html) to calculate, among other variables, PET, AET, and relative humidity (needed for DEF and VPD). Monthly precipitation and temperature time series are independently derived but bias corrected (34) against PRISM and therefore are consistent with values used in other ecological studies (13, 35). Monthly climatic data include total precipitation, maximum temperature, VPD, and DEF. Temperature and precipitation deltas (changes from historical climate) were derived from an ensemble of 10 climate models from the World Climate Research Program (WCRP) Coupled Model Intercomparison Project phase 3 (CMIP3) run under Special Report on Emission Scenarios A1B emissions. These future deltas were applied to gridded historical temperature and precipitation time series (1916–2006) to create future climate input for the VIC model. Results were summarized for mid and late 21st century (2040s: 2030–2059; 2080s: 2070–2099) (https://www.sciencebase.gov/catalog/item/55e4c25ce4b05561fa208552). CMIP3 models can be considered realizations of the same probability distribution as CMIP5 (36), although the A1B scenario would represent less warming than the Representative Concentration Pathways 8.5 scenario by the end of the 21st century, in which case our estimates of future VPD would likely be conservative (low) unless humidity increased to match the rate of temperature change. CMIP5-derived hydroclimate simulations were not available to us at the time of analysis.
Chronology Development.
We used standard dendrochronological techniques to measure, detrend, standardize, and “prewhiten” each tree-ring time series (37). All cores were measured using a sliding stage (precision = 0.001 mm) and were crosschecked for errors using Cofecha statistical software. To account for the geometric bias of ring width imposed by age/size (e.g., larger trees put on narrower rings), we detrended the time series with a cubic smoothing spline for which the frequency response was 0.50 (retained 50% of the variance) at a wavelength equal to two-thirds of the length of the series. The cubic smoothing spline is appropriate for a dataset with such a large geographic extent because the curve fit to each series is unique, taking into consideration different ages, competition, and stand disturbance histories. Detrended time series then were subtracted from the fitted spline to create a ring-width index (RWI), a unit-less metric used as a proxy for annual ring width. Finally, prewhitened (or residual) chronologies were calculated to remove the temporal autocorrelation in each time series by performing autoregressive modeling, with the autoregressive order based on the persistence identified in each time series. The residual chronologies are preferred over raw chronologies for analysis because, after detrending, standardization, and prewhitening, the remaining interannual variance can be attributed to climate. For both the standardized and residual chronologies, years were retained only if sampling depth was at least five cores.
We developed chronologies at the plot, watershed, and region scales using Dendrochronology Program Library in R (dplR) (38). Plot-scale chronologies were calculated by aggregating individual tree chronologies with a Tukey’s biweight robust mean. For the watershed scale, the chronologies were recalculated starting from the individual tree and followed the same methods used for the plot-scale chronologies for detrending, standardization, and prewhitening. Regional-scale chronologies were calculated as a mean of the watershed-scale chronologies in a given region. To aid in visual interpretations, regional-scale chronologies were also calculated as z-scores which scale all data to a mean of 0 and SD of 1.
Acknowledgments
We thank R. Norheim for cartographic assistance; G. Mauger for providing climatic data; N. Povak and M. Kennedy for analytical consultation; Nathan Stephenson and Don McKenzie for preliminary reviews of this manuscript; the modeling groups, the Program for Climate Model Diagnosis and Intercomparison, and the WCRP Working Group on Coupled Modelling for making available the WCRP CMIP3 multimodel dataset, which is supported by the US Department of Energy Office of Science. Funding for this work was provided by National Science Foundation Graduate Research Fellowship Program Grant DGE-0718124, the US Geological Survey Global Change Research Program, the US Forest Service Pacific Northwest Research Station, and the US Department of the Interior Alaska Climate Science Center. This paper is a contribution of the Western Mountain Initiative.
Footnotes
The authors declare no conflict of interest.
This article is a PNAS Direct Submission.
This article contains supporting information online at www.pnas.org/lookup/suppl/doi:10.1073/pnas.1602384113/-/DCSupplemental.
References
- 1.Allen CD, et al. A global overview of drought and heat-induced tree mortality reveals emerging climate change risks for forests. For Ecol Manage. 2010;259(4):660–684. [Google Scholar]
- 2.Zhao M, Running SW. Drought-induced reduction in global terrestrial net primary production from 2000 through 2009. Science. 2010;329(5994):940–943. doi: 10.1126/science.1192666. [DOI] [PubMed] [Google Scholar]
- 3.Bentz B, et al. Climate change and bark beetles of the western United States and Canada: Direct and indirect effects. Bioscience. 2010;60(8):602–613. [Google Scholar]
- 4.Hicke JA, Johnson MC, Hayes JL, Preisler H. Effects of bark beetle-caused tree mortality on wildfires: A review. For Ecol Manage. 2012;271:81–90. [Google Scholar]
- 5.McDowell N, et al. Mechanisms of plant survival and mortality during drought: Why do some plants survive while others succumb to drought? New Phytol. 2008;178(4):719–739. doi: 10.1111/j.1469-8137.2008.02436.x. [DOI] [PubMed] [Google Scholar]
- 6.van Mantgem PJ, et al. Widespread increase of tree mortality rates in the western United States. Science. 2009;323(5913):521–524. doi: 10.1126/science.1165000. [DOI] [PubMed] [Google Scholar]
- 7.McKenzie D, Peterson DL, Littell J. Global warming and stress complexes in forests of western North America. In: Bytnerowicz A, Arbaugh MJ, Riebau AR, Andersen C, editors. Wildland Fires and Air Pollution. Elsevier; The Hague: 2009. pp. 317–337. [Google Scholar]
- 8.Fritts HC. Relationships of ring widths in arid-site conifers to variations in monthly temperature and precipitation. Ecol Monogr. 1974;44(4):411–440. [Google Scholar]
- 9.Littell JS, Peterson DL, Tjoelker M. Douglas-fir growth in mountain ecosystems: Water limits tree growth from stand to region. Ecol Monogr. 2008;78(3):349–368. [Google Scholar]
- 10.Williams AP, et al. Forest responses to increasing aridity and warmth in the southwestern United States. Proc Natl Acad Sci USA. 2010;107(50):21289–21294. doi: 10.1073/pnas.0914211107. [DOI] [PMC free article] [PubMed] [Google Scholar]
- 11.Bréda N, Huc R, Granier A, Dreyer E. Temperate forest trees and stands under severe drought: A review of ecophysiological responses, adaptation processes and long-term consequences. Ann Sci. 2006;63(6):625–644. [Google Scholar]
- 12.Adams HD, et al. Temperature sensitivity of drought-induced tree mortality portends increased regional die-off under global-change-type drought. Proc Natl Acad Sci USA. 2009;106(17):7063–7066. doi: 10.1073/pnas.0901438106. [DOI] [PMC free article] [PubMed] [Google Scholar]
- 13.Williams AP, et al. Temperature as a potent driver of regional forest drought stress and tree mortality. Nat Clim Chang. 2013;3(3):292–297. [Google Scholar]
- 14.Stephenson NL. Actual evapotranspiration and deficit: Biologically meaningful correlates of vegetation distribution across spatial scales. J Biogeogr. 1998;25(5):855–870. [Google Scholar]
- 15.Stephenson NL. Climatic control of vegetation distribution- the role of water balance. Am Nat. 1990;135(5):649–670. [Google Scholar]
- 16.Griesbauer HP, Green DS. Regional and ecological patterns in interior Douglas-fir climate-growth relationships in British Columbia, Canada. Can J Res. 2010;40(2):308–321. [Google Scholar]
- 17.Chen PY, Welsh C, Hamann A. Geographic variation in growth response of Douglas-fir to interannual climate variability and projected climate change. Glob Change Biol. 2010;16(12):3374–3385. [Google Scholar]
- 18.Nehrbass-Ahles C, et al. The influence of sampling design on tree-ring-based quantification of forest growth. Glob Change Biol. 2014;20(9):2867–2885. doi: 10.1111/gcb.12599. [DOI] [PubMed] [Google Scholar]
- 19.Liang X, Lettenmaier DP, Wood EF, Burges SJ. A simple hydrologically based model of land surface water and energy fluxes for general circulation models. J Geophys Res. 1994;99(7):14415–14428. [Google Scholar]
- 20.Njissen BN, Lettenmaier DP, Liang X, Wetzel SW, Wood EF. Streamflow simulation for continental-scale river basins. Water Resour Res. 1997;33(4):711–724. [Google Scholar]
- 21.Woodruff DR, Meinzer FC, McCulloh KA. Height-related trends in stomatal sensitivity to leaf-to-air vapour pressure deficit in a tall conifer. J Exp Bot. 2010;61(1):203–210. doi: 10.1093/jxb/erp291. [DOI] [PubMed] [Google Scholar]
- 22.Rehfeldt GE. Ecological adaptations in Douglas-fir (Pseudotsuga menziesii var. glauca): A synthesis. For Ecol Manage. 1989;28(3):203–215. [Google Scholar]
- 23.Farquhar GD, von Caemmerer S, Berry JA. A biochemical model of photosynthetic CO2 assimilation in leaves of C 3 species. Planta. 1980;149(1):78–90. doi: 10.1007/BF00386231. [DOI] [PubMed] [Google Scholar]
- 24.Medlyn BE, et al. Temperature response of parameters of a biochemically basedmodel of photosynthesis. II. A review of experimental data. Plant Cell Environ. 2002;25(9):1167–1179. [Google Scholar]
- 25.Stewart DW, Dwyer LM. Stomatal response to plant water deficits. J Theor Biol. 1983;104(4):655–666. [Google Scholar]
- 26.Bunce JA. Does transpiration control stomatal responses to water vapour pressure deficit? Plant Cell Environ. 1997;20(1):131–135. [Google Scholar]
- 27.Oren RJ, et al. Survey and synthesis of intra- and interspecific variation in stomatalsensitivity to vapour pressure deficit. Plant Cell Environ. 1999;22(12):1515–1526. [Google Scholar]
- 28.van Oldenborgh GJ, et al. 2013. Climate change 2013: The physical science basis. Contribution of Working Group I to the Fifth Assessment Report of the IPCC (Cambridge Univ Press, Cambridge, UK)
- 29.Gedalof ZE, Berg AA. Tree ring evidence for limited direct CO2 fertilization of forests over the 20th century. Global Biogeochem Cycles. 2010;24(3):1–6. [Google Scholar]
- 30.Fritts HC. Tree Rings and Climate. Academic; New York: 1976. [Google Scholar]
- 31.Ainsworth EA, Long SP. What have we learned from 15 years of free-air CO2 enrichment (FACE)? A meta-analytic review of the responses of photosynthesis, canopy properties and plant production to rising CO2. New Phytol. 2005;165(2):351–371. doi: 10.1111/j.1469-8137.2004.01224.x. [DOI] [PubMed] [Google Scholar]
- 32.Bailey RG. Identifying ecoregion boundaries. Environ Manage. 2004;34(1) Suppl 1:S14–S26. doi: 10.1007/s00267-003-0163-6. [DOI] [PubMed] [Google Scholar]
- 33.Thompson RS, Anderson KH, Bartlein PJ. 2000. Introduction and Conifers. Atlas of Relations Between Climatic Parameters and Distributions of Important Trees and Shrubs in North America (US Geological Survey, Reston, VA), US Geological Survey Professional Paper, Vol 1650-A.
- 34.Elsner MM, et al. Implications of 21st century climate change for the hydrology of Washington State. Clim Change. 2010;102(1-2):225–260. [Google Scholar]
- 35.Daly C, et al. Physiographically sensitive mapping of climatological temperature and precipitation across the conterminous United States. Inter J Clim. 2008;28(15):2031–2064. [Google Scholar]
- 36.Knutti R, Sedláček J. Robustness and uncertainties in the new CMIP5 climate model projections. Nat Clim Chang. 2013;3(4):369–373. [Google Scholar]
- 37.Cook ER, Kairiukstis LA. Methods of Dendrochronology: Applications in the Environmental Sciences. Kluver Academic Publishers; Dordrecht, The Netherlands: 1990. [Google Scholar]
- 38.Bunn AG. A dendrochronology program library in R (dplR) Dendro. 2008;26(2):115–124. [Google Scholar]


