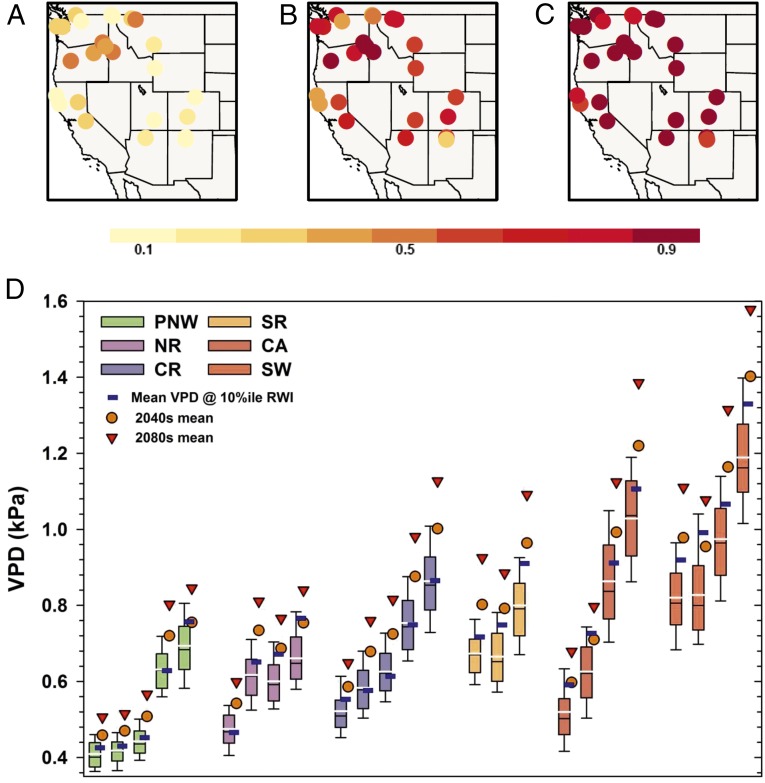
Fig. 5.
Douglas fir growth in a future climate. Historical and future mean growing season (AMJJ) VPD associated with 10th percentile Douglas fir growth and exceedance probability under future climate scenarios. (A) Historical probability. (B) 2040s. (C) 2080s. (D) Box-and-whisker plots represent the site-scale VPD. Black lines indicate the median; white lines indicate the mean; blue squares indicate mean values associated with 10th percentile growth. Each box-and-whisker plot represents an individual study site. Sites are ordered by elevation, from high to low. As shown in A, the historical probability of exceeding the 10th percentile mean is relatively low and variable (0.12–0.53). Future climate scenarios project increases in the mean that greatly exceed the historical range of variability (D), and by the 2080s the exceedance probability increases to 0.66–1.0 (C).

