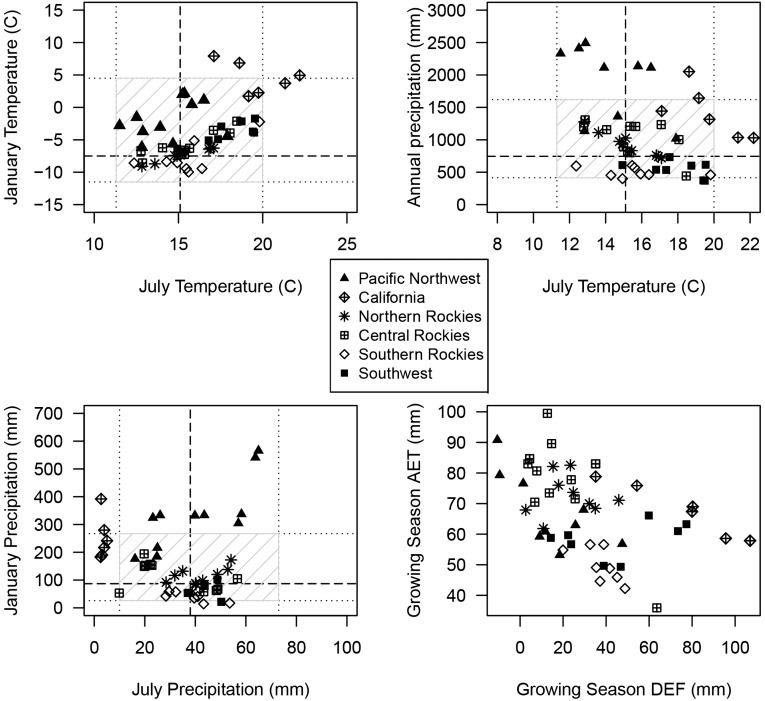
Fig. S1.
Distribution of sampling sites in climate space. The climatic limits of Douglas fir (34) are represented as 10th and 90th percentiles (dotted lines) and 50th percentiles (dashed line). The hatched box symbolizes the fundamental climate niche of Douglas fir. Sampling sites are plotted in this climate space based on average values (1916–2006) of the variables indicated. The distribution of sample sites represents the realized climate niche of Douglas fir.

