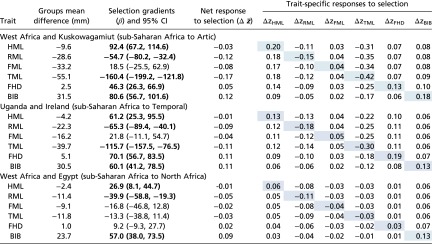
Table 2.
Examples of directional selection estimated between sub-Saharan African and non–sub-Saharan African groups: differences in trait means between groups, estimated selection gradients (β), net response to selection (∆ ), and correlated responses to selection on traits that combine to yield the net response (∆zelement)
 |
Within the trait-specific responses to selection matrix, direct responses to selection are shaded, and indirect (correlated) responses are not. Bold text indicates estimated selection gradients with 95% CIs that do not overlap with zero. All pairwise comparisons between sub-Saharan African and non–sub-Saharan African groups are presented in SI Appendix, Tables S1a–S1nn.
