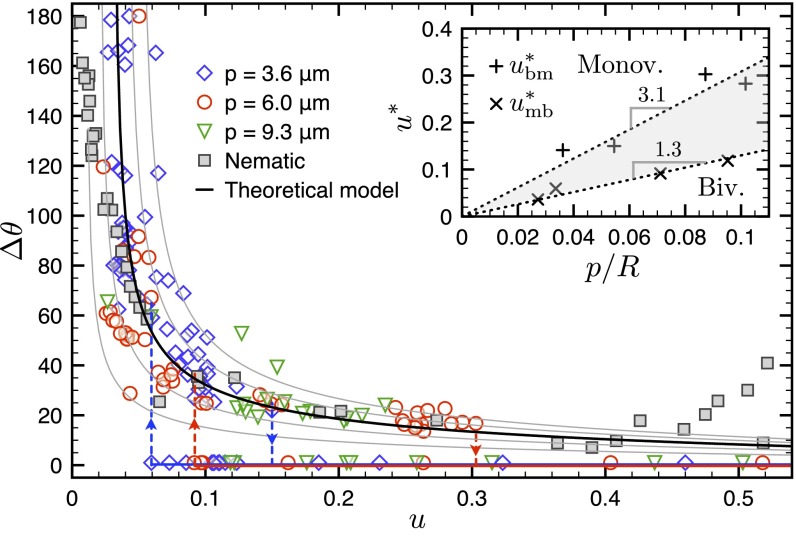
Fig. 4.
Evolution of as a function of for different cholesteric mixtures of 5CB and CB15. Each point corresponds to a different experimental shell with a given geometry u, and each symbol/color corresponds to a different value of p (p = 9.3, 6, or 3.6 ). The data for (nematic) have been taken from ref. 9. The solid lines represent the theoretical curves, for different values of the minimal shell thickness , obtained from solving in Eq. 1. The dashed lines containing down arrows indicate the critical values of u, denoted , above which no bivalent shells are found. The dashed lines containing up arrows indicate the critical values of u, denoted , below which no monovalent shells are found. To facilitate the reading of the image, we have plotted these lines only for the blue and red symbols. (Inset) Evolution of and as a function of . The gray region corresponds to the zone where the two configurations coexist.

