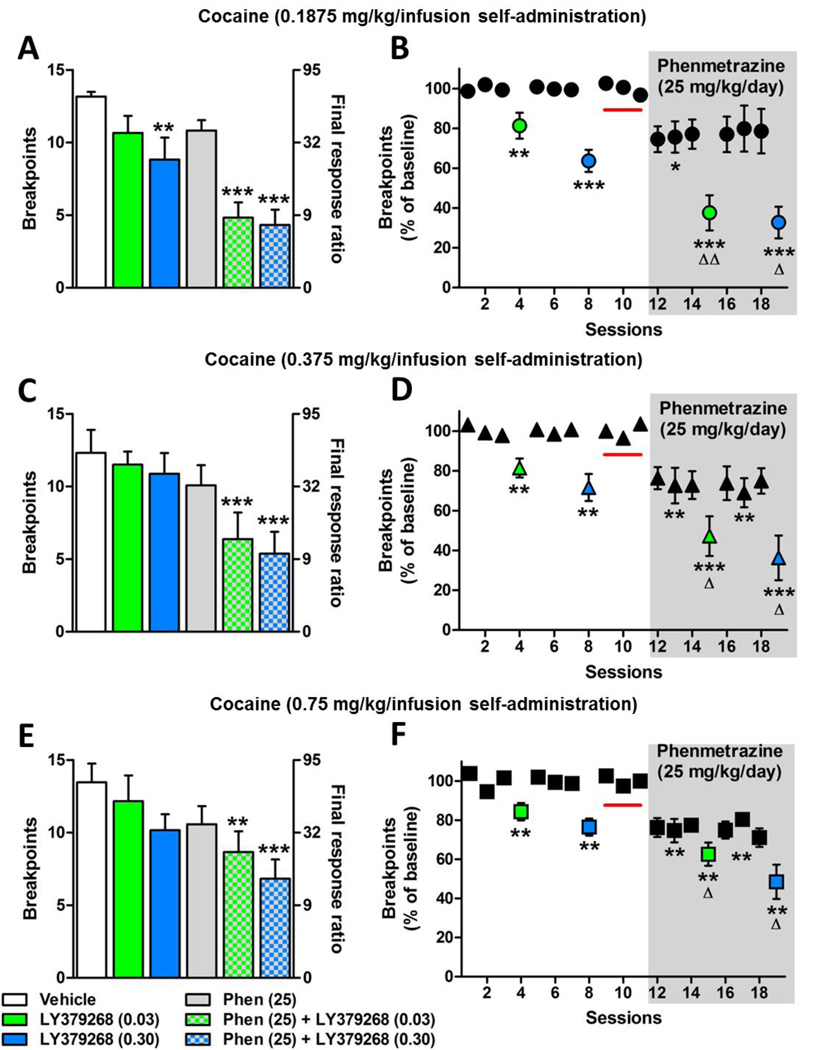
Figure 3.
The individual and combined effects of phenmetrazine (shaded/gray area) and LY379268 (0.03 mg/kg, green; 0.30 mg/kg, blue) on breakpoints during progressive-ratio responding for cocaine expressed as raw breakpoints (left column; A, C, E) and as a percent of baseline (right column; B, D, F). In panels A, C, and E, bars are plotted for linear breakpoints on left y-axis and corresponding final response ratios on log scale are plotted on right y-axis for comparison. Number of animals: A, B (n=6); C, D (n=8); E, F (n=6). Red line signifies baseline for phenmetrazine alone and combined treatment. *p<0.05, **p<0.01, ***p<0.001, comparison to respective baseline breakpoints. Δp<0.05, ΔΔp<0.01, combined treatment compared to the respective LY379268 dose. Data points are expressed as mean±SEM.

