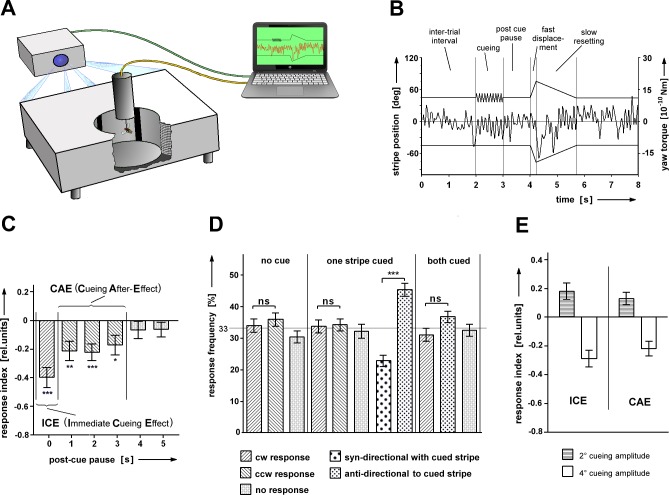
Fig 1. Cueing in selective visual attention.
(A) Apparatus: Light-guide arena and torque meter. (B) Experimental procedure. The fly is attached to a torque-meter and positioned in the center of a light-guide arena. Stimuli are generated by a computer and projected onto one end of the light-guides. These display the visual stimuli at the inner surface of the arena. Two black stripes (width w = 18°; at ψ0 = + 45° and ψ0 = – 45°) are displaced from front to back on white background (Δψ = 30° at 150°/s) and then slowly reset to their initial position (v = 20°/s). They remain there for the inter-trial interval (ITI). The displacement may be preceded by an oscillation of one of the stripes (cue; e.g. Δψcue = 15°, fcue = 10Hz and durcue = 1s) and a post-cue pause. (C) Immediate cueing and cueing after-effect. If the cue is immediately followed by the test, a strong bias in the response frequencies can be seen (ICE). It is slightly reduced, if a post-cue pause of 1, 2 or 3s is introduced (CAE). If the stripes remain stationary after the cue for 4 or 5s, the cue does no longer bias the responses towards the not cued stripe. Stripe width w = 18°; oscillation amplitude Δψcue = 15° (N = 52). (D) Cueing does not reduce the overall response rate. The same flies are tested either without cueing, with cueing of one stripe or cueing of both stripes (N = 71). (E) ICE and CAE are observed with positive and negative cueing (stripe width w = 6°; Δψcue = 2° for attractive cueing; Δψcue = 4° for repulsive cueing; N = 22). Error bars are SEMs (*P < 0.05, **P < 0.01, ***P < 0.001).

