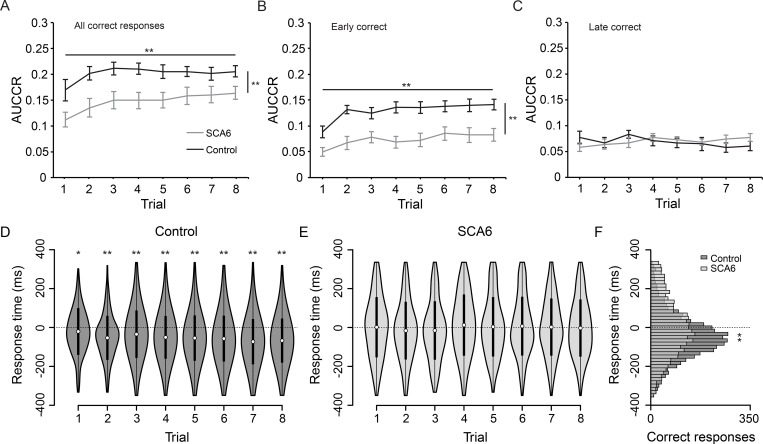
Fig 2. Results training session of predictive timing task.
(A) Task performance showing all correct responses, expressed as area under the curve of the correct ratio (AUCCR) for both controls and SCA6 patients, showing a learning effect and a difference between groups. (B) AUCCR of early correct responses only, where the learning effect and group differences are present. (C) AUCCR of late correct responses only, where no learning effect or group differences are present. (D) Response times distributions of correct button presses of controls. Average response times are significantly lower than 0ms on all trials (asterisks). (E) Response times distributions of correct button presses of SCA6 patients. Average response times are not significantly different from 0ms on any of the trials. (F) Distribution of pooled response times for all training trials, showing that controls time their button press more precisely as observed by a smaller variance compared to SCA6 patients (asterisks). (A, B, C) Error bars represent SEM, ** indicates P < 0.01 for main effects of trials (asterisks horizontal line) and main effects of group (asterisks vertical line). (D, E) White dots represent the mean and black bars represent the SD. (F) Histogram shows 16.7ms bins. * indicates P < 0.05, ** indicates P < 0.01.

