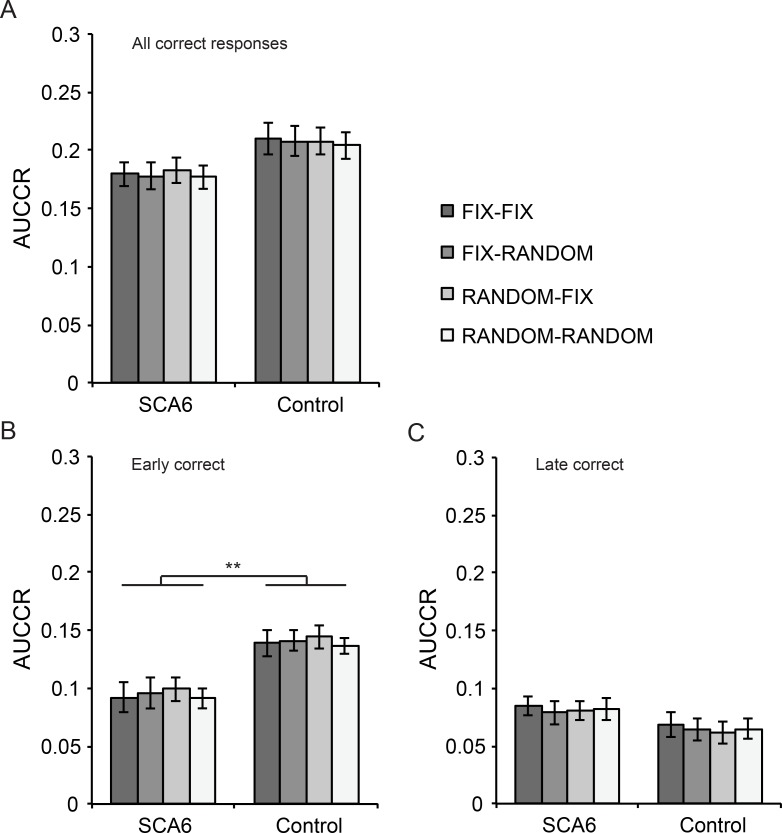
Fig 3. Results experimental sessions of predictive timing task.
(A) Task performance on different trial conditions is visualized for both SCA6 patients and controls. No differences between groups or between conditions are observed in all correct responses. (B) AUCCR calculated for early correct responses shows a significant group difference between SCA6 patients and controls, but not between conditions. (C) AUCCR calculated for late correct responses does not show any differences between conditions or between groups. Error bars represent SEM, ** indicates P < 0.01.

