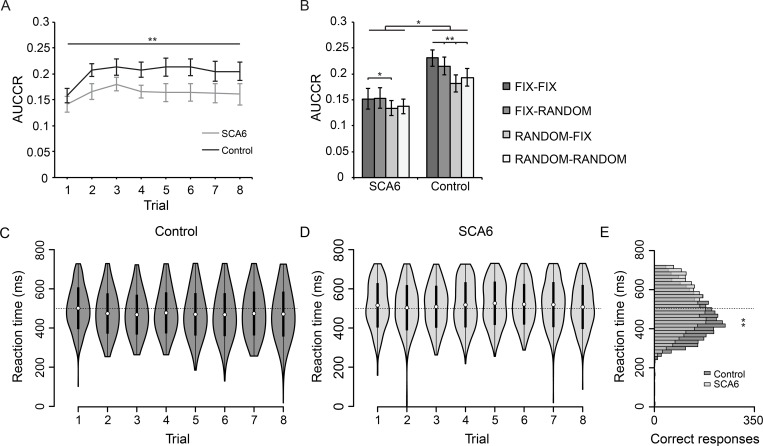
Fig 4. Results of reactive timing task.
(A) Task performance expressed as AUCCR of correct responses after marker flash for both controls and SCA6 patients, showing that learning occurs over the course of the trials (asterisks horizontal line). (B) AUCCR calculated for different trial conditions during experimental sessions. The data shows group differences, as well as differences between all conditions with the FIX-FIX condition in the control group, but only between the RANDOM-FIX and the FIX-FIX condition in the SCA6 group. (C) Reaction time distributions of correct button presses during training for controls and (D) for SCA6 patients. (F) Distribution of pooled reaction times for all training trials. Variance of the reaction time distribution was smaller in controls (asterisks). (A, B) Error bars represent SEM, * indicates P < 0.05, ** indicates P < 0.01 for main effects of trials (asterisks horizontal line panel A) and main effects of condition and group (asterisks panel B). (D, E) Dotted line indicates 500ms for visual aid, white dots represent the mean and black bars represent the SD. (F) Histogram shows 16.7ms bins. ** indicates P < 0.01.

