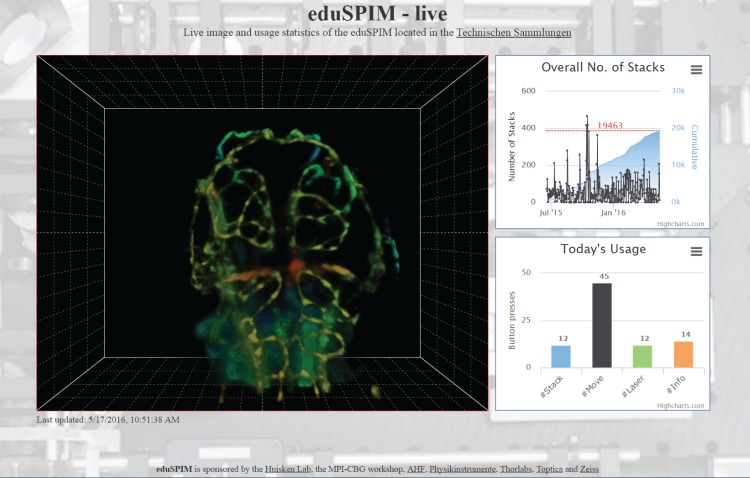
Fig 2. Screenshot of the eduSPIM website, http://www.eduspim.org.
The page was divided into three panels: the main panel containing a snapshot of the latest rendering displayed on the microscope computer (left), a diagram showing the number of stacks acquired since the exhibition was opened (upper right) and a histogram indicating how often each button was pressed on the current day (lower right). All panels were dynamically updated using JavaScript. The data shown here were acquired in stack mode. The fluorescence signal was rendered using a combination of volume ray casting and depth colour coding.

