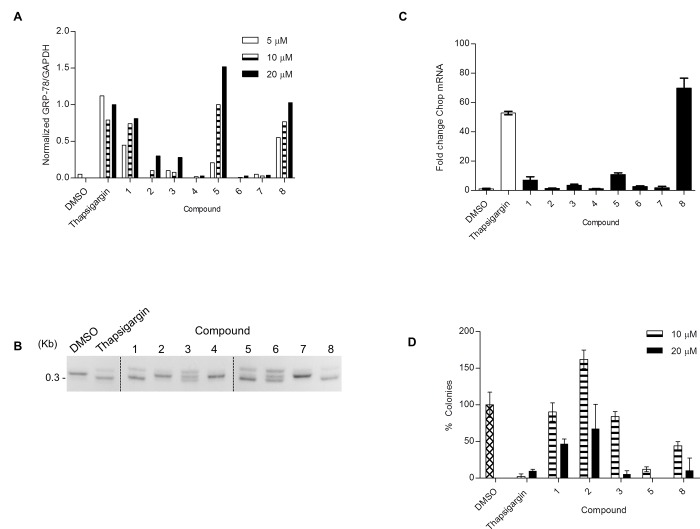
Fig 3. Secondary assays identify bona fide ERSR inducers with cytotoxicity activity.
(A) U87-MG cells treated with the indicated compounds were analyzed by immunoblot for GRP78 expression. GAPDH levels were used as housekeeping controls. Data are represented as GRP78/GAPDH ratio for each compound and normalized to the GRP78/GAPDH ratio for 20 μM thapsigargin. See S3 Fig for blot images. (B) U87-MG cells were treated with DMSO, 1 μM thapsigargin or 20 μM of indicated compound for 16 h. XBP-1 mRNA splicing was monitored by RT-PCR using XBP-1-specific primers, which amplify a spliced or unspliced fragment of 304 or 326 bp, respectively. (C) U87-MG cells were treated with DMSO, 1 μM thapsigargin or 20 μM of indicated compound for 24 h. CHOP and housekeeping GAPDH mRNA levels were monitored by qRT-PCR. Data is plotted relative to the DMSO treated sample set to 1. Error bars indicate the SD of three replicates. (D) U87-MG cells treated with the indicated compounds were tested for their ability to form colonies. Data are presented as the number of colonies, normalized to vehicle DMSO. Error bars indicate SE with n = 3. See S5 Fig for representative images.

