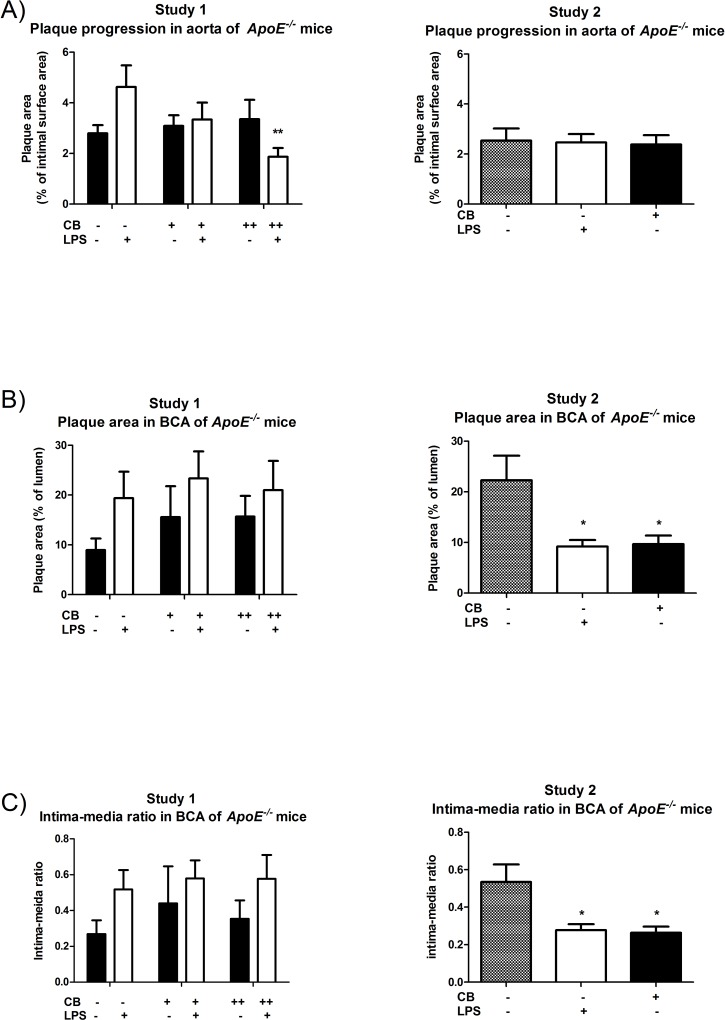
Fig 4. Progression of atherosclerotic plaques in the aorta and brachiocephalic artery from ApoE-/- mice exposed to carbon black (CB) and/or lipopolysaccharide (LPS) by i.t. instillation.
A) Atherosclerotic plaque area is expressed as the percentage of the luminal surface of the aorta covered with plaques. Calculations were made on whole aorta preparations from ascending aorta to the iliac bifurcation. B) Atherosclerotic plaque area expressed as the percentage of the lumen occupied by plaques in BCA. Six sections of BCA per animal were analyzed; three sections at 100 μm and three sections at 200 μm after the branch from the aortic arch (n = 6–10 mice per group). C) The intima-media ratio in BCA is calculated by dividing the area of the intima with the area of the media layer (n = 6–10 mice per group). Black bars represent the groups that did not receive LPS and white bars the groups that did receive LPS. Minus (-) denotes no exposure, plus denotes low (+) or high-dose (++) exposure. Data are presented as mean and SEM. Asterisks denote statistical significance *P<0.05, using one-way ANOVA with Tukey’s post-hoc test, and **P<0.01, two-factor ANOVA with Fisher’s LSD post-hoc test.

