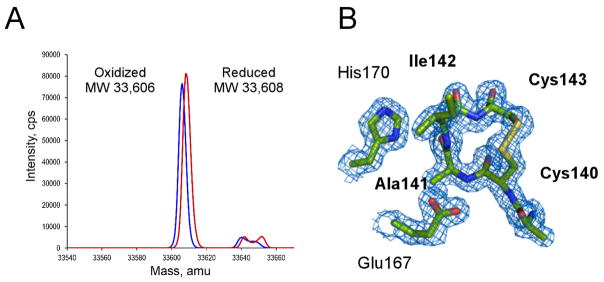
Figure 3. Reduced and oxidized EhTrxR.
A, ESI-MS analysis of reduced (red) and oxidized (blue) EhTrxR. 2 Da experimental mass difference between NADPH-plus and NADPH-minus samples corresponds to reduction of one disulfide bond in the NADPH-treated sample. B, 2Fo-Fc electron density map (blue mesh) contoured at 1.0 σ shows the oxidized redox-active sulfhydryl groups forming a 4-residue disulfide loop.

